Key Takeaways
- Callable bonds have become popular over the years as a means for some fixed income investors to generate incremental yield.
- In a rising rate environment, issuers of callable bonds are less likely to exercise that call feature, which may make them more attractive to investors.
- While callable bonds can be effective additions to portfolios, the specifics of the call features can vary significantly and must be thoroughly understood to conduct a proper risk vs. reward calculation.
This month’s main article, Understanding Agency Callables, focuses on the features of agency callable bonds as well as both the benefits and risks to investors who hold these investments in a rising rate environment.
Also included are the following themes:
Economic Vista: Understanding agency callables
Patty Kao, Head of SVB Asset Management, and Rohan Ashar, Portfolio Analyst
In part due to historically low yields over the past decade, callable bonds have become popular as a way for many fixed income investors to generate incremental yield. But what exactly are these bonds, and are they an appropriate tool given the new rising rate environment?
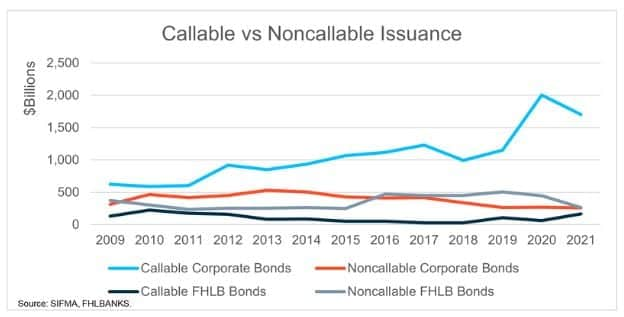
A callable bond is one that allows the issuer to redeem the value of the bond prior to the final maturity date at a prespecified price and date(s). In other words, the call feature gives the issuer an option to pay back its debt earlier. This feature is valuable to the issuer because of the additional flexibility it provides in managing borrowing costs. For example, in a declining interest rate environment, an issuer may exercise the call feature (early redemption) so it can then reborrow at a lower rate, similar to refinancing a mortgage. In this case, the investor (bondholder) will need to reinvest proceeds, possibly in lower yielding securities. Therefore, investors are compensated (in the form of higher yields at issuance, compared to most fixed maturity bonds) for the possibility of the bond being called. Thus, an investor should expect higher yields for callable bonds when compared to similar maturity noncallable bonds. Call features on specific bonds can be one-time-only, at certain intervals (e.g., quarterly) or continuous after a certain “lockout” period (say, after the first year).
The US agencies are some of the largest issuers of callable bonds with more than $500 billion in notional outstanding (roughly 30% of the $1.7 trillion in total agency debt outstanding). Agency securities are issued by a government-sponsored enterprise1 (GSE), such as the Federal Home Loan Bank (FHLB) system. The largest agency issuers — FHLB, Federal Farm Credit Bank (FFCB), Federal National Mortgage Association (FNMA or “Fannie Mae”) and Federal Home Loan Mortgage Corporation (“Freddie Mac”) — have credit ratings that are virtually identical to those of the US Treasury (AAA/AA+). In other words, they are considered relatively safe investments with lower credit risk. It’s true that agency bonds are not direct obligations of the government, and they are not backed by the “full faith and credit” of the United States. However, many investors consider their debt to be implicitly guaranteed. As we mentioned above, in a low-rate environment, agency bonds have been attractive because they’ve offered higher yields (compared to Treasuries) but still provide relative safety and liquidity.
__________________________
1 Organizations established by Congress to support a public policy objective (such as affordable housing or farming).

Details Matter
As with all fixed income investments, and especially when stretching for a bit more yield, the details and covenants matter. When analyzing callable securities, investors should evaluate both yield-to-call (YTC) and yield-to-maturity (YTM), as well as the time horizon of this investment. YTC measures the yield based on the call date, while YTM measures the yield on the final maturity. So how do both metrics stack up to other comparable but noncallable bonds?
Consider a scenario with two 2-year bonds: One is callable every quarter, yielding 5%, and the other is not callable, yielding 4.25%. The investor must evaluate the risk and reward. Does the investor value the certainty of 4.25% in yield over the 2-year period? Or is it preferable to have a 5% yield with the understanding that the bond may be called each quarter prior to maturity? Is the 0.75% pickup in yield a fair trade-off for the uncertainty of whether the bond will be called? The risk for the investor is that yields may be significantly lower in year two for reinvestment. For example, in a declining rate environment, similar yielding bonds may be at 3%, compared to 5% for the original noncallable bond in year two.
However, given the current macroeconomic environment and rising rate trend, callable bonds may be less likely to be called in the near term. In the September Federal Open Market Committee (FOMC) meeting, the fed fund target rate was increased by 75 basis points (bps) to a range of 3.00% to 3.25%. The market is also forecasting additional rate hikes, which could bring the fed funds rate to a range of 4.25% to 4.50% by the end of 2022. A callable bond investor will likely be more comfortable taking on redemption risk if he or she believes that future interest rates will increase. If this prediction is accurate, the investor may capture a higher return throughout the life of the bond. After all, the issuer of the callable bond would not be able to redeem the bond and then reissue at a lower yield.
This is just one scenario that illustrates the potential of callable bonds and how they might boost yield in a risk-appropriate manner. Under the right circumstances, these callables may be an effective addition to a diversified fixed income portfolio, but, as always, investors must evaluate their individual circumstances and understand how future interest rate moves may affect their holdings.
Credit Vista: Edges fray, but tapestry remains intact
In a prior blog post we wrote about how credit metrics were extremely strong at the end of 2021, well above pre-pandemic levels. But given the turmoil and volatility in both fixed income and equity markets this year, we thought it prudent to provide an update on the issue. The data suggests that issuers remain healthy, especially across the investment-grade landscape.
The Federal Reserve’s message of fighting inflation through large increases to the federal funds rate is starting to reverberate through the economy and is being felt across both issuers and households. Tighter economic conditions can shift the outlook for firms who have mostly enjoyed strong demand over the last two years. But now, the Fed appears intent on cooling the economy and wage growth, but a byproduct of that can be stress across many types of lower-rated credit. For the moment, however, investment-grade credit remains insulated. Typically, problems in the high-yield sector can act as an early warning system for stress creeping into the investment-grade market, so we monitor it closely. But the alarms are not ringing yet. SVB Asset Management’s issuer selection appears well positioned to endure the stresses that typically come with a rising rate environment.
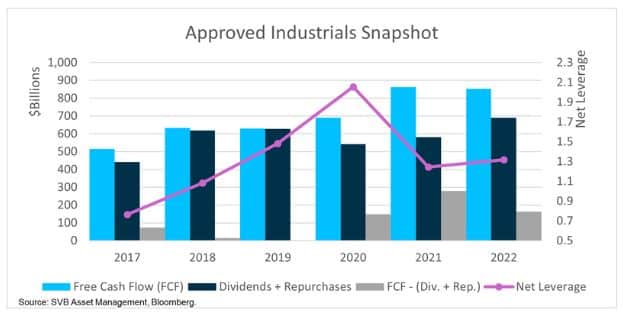
Industrial issuers saw significant improvement in their overall credit quality in 2021. A few months ago, we noted that we saw record levels of free cash flow and declining leverage ratios. Many issuers used these constructive conditions to strengthen their balance sheets. Debt was refinanced at borrower friendly levels. A steep drop in leverage was seen across our issuer base, and we felt that credit conditions were remarkably positive. As we now see economic conditions tighten, we note that our issuer base has been able to emerge from the pandemic with favorable credit levels. This should be a solid buffer in the face of any headwinds from the rising rate environment and slowing economic backdrop. Even as leverage begins to creep higher, we feel that our industrial issuer base is well equipped to handle extended periods of economic weakness due in large part to how they managed their credit quality during the pandemic. A normalization towards 2019 levels is likely the result, rather than any dire credit crunch, in our opinion.

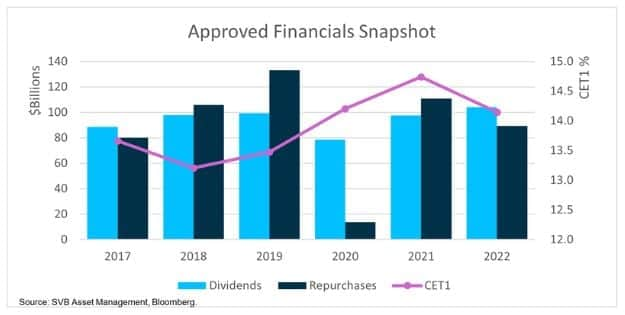
Reviewing our financial issuers illustrates a similar story. With dividends and repurchases either frozen or substantially reduced during early 2020, banks improved their capital bases. While it was not expected during the peak of the 2020 pandemic, bank asset quality remained extremely strong over the next two years. Net charge-offs and impairments touched decade lows, though we expect this trend to reverse modestly over the coming year. Bank capital is beginning to come off the highs of 2021, with capital being deployed for share repurchases. Regulatory capital requirements remain high for most global banks, and at most we expect a moderate decline in aggregate capital levels. Bank profitability should be positioned to benefit from a rising rate environment, but even with an uptick in profitability, banks are expected to begin taking more provisions to cover for tightening economic conditions.

So, what’s the bottom line? We’re starting to see the first signs of stress across credit markets, with non-investment grade defaults beginning to rise. This, along with the Fed’s laser focus on reining in demand, could challenge some companies with weaker financials. However, many issuers in our selected universe came into the year in a very strong position, so even as conditions begin to deteriorate, they appear well insulated. We remain vigilant on corporate credit conditions as we enter a Fed-orchestrated economic slowdown, but we remain optimistic and do not expect widespread chaos that has been associated with prior steep troughs in the economy.
Trading Vista: Ratcheting up rates
Kyle Lojek, Fixed Income Trader
As widely expected, the Fed jacked up the federal funds interest rate by another 75 bps in September, bringing the target range to 3.00%-3.20%. With the Fed’s aggressive policy shift, it’s no surprise that we’ve seen significant volatility throughout 2022. Steep intraweek rallies and consequent retracements have seemingly become the new normal. Federal officials have maintained their hawkish tone in their various commentaries and presentations, emphasizing that future moves will be data dependent even as they keep a watchful eye on elevated inflation prints. With inflation entrenched and the Fed resolved to combat it, the probability of a recession in the coming months continues to climb, with some models putting the odds over 25% in the next 12 months. Given the uncertainty surrounding future rate moves and the general health of the economy, many investors are reluctant to add significant duration. In turn, this has left money markets flush with cash.
Despite rates coming off the zero bound, the aggressive rate hikes and subsequent bouts of volatility have made the front end of the curve more attractive. Yields continue to peak in short duration with the curve flattening, resulting in little difference between 1-year and 3-year Treasury investments. According to the fed funds futures, markets are now projecting 125 bps in additional rate increases through early next year, which is expected to bring money market fund yields close to 4%. Given this outlook, it’s no surprise that investors’ focus remains on the front end of the curve. Even money market fund complexes themselves have been leading this charge, where their weighted average maturities (WAMs) have shortened more than 60% year to date (YTD). Meanwhile, balances at the Fed’s reverse repo facility set a new high-water mark of $2.4 trillion in September.
Until inflation is tamed, investors should expect rapid shifts in benchmark yields as market expectations ebb and flow. The yield on the 2-year US Treasury has ranged from 3.38% to 4.28% in September — a fairly wide spread of 90 bps compared to a much more discrete range of approximately 20 bps at the end of last year. While all of this makes for striking headlines, it’s important to remember that market volatility also presents unique opportunities. Depending on the structure of each client’s portfolio, cash can be tactically deployed between spread and rate-derived assets. In general, portfolios have benefitted from a steady march higher in rates.
We also have seen new security types gain popularity as market dynamics shift. For example, government agency debt has roared into a more prominent position after being dormant for years. But as deposits continue to shrink and banks turn to alternative funding options, agency discount notes have cheapened relative to US Treasuries. Agencies have increased issuance to match their short-term funding needs, and discount note issuance has climbed more than 80% compared to January.
These are interesting times in fixed income markets, and the volatility can be unnerving. However, we remain vigilant as we progress through the final quarter of the year, and we’ll continue to monitor and scrutinize market moves for opportunities to capture yield in a risk-appropriate manner.
Markets |
|||
|---|---|---|---|
| Treasury Rates: | Total Returns: | ||
| 3-Month | 3.25% | ICE BofA 3-Month Treasury | 0.25% |
| 6-Month | 3.90% | ICE BofA 6-Month Treasury | 0.16% |
| 1-Year | 3.93% | ICE BofA 12-Month Treasury | -0.44% |
| 2-Year | 4.28% | S&P 500 | -9.22% |
| 3-Year | 4.29% | Nasdaq | -10.44% |
| 5-Year | 4.09% | ||
| 7-Year | 3.98% | ||
| 10-Year | 3.83% | ||
|
Source: Bloomberg and Silicon Valley Bank as of 09/30/2022. |
|||

