Key Takeaways
- The early results of the Federal Reserve’s new monetary policy suggest a softening economy, but probably not enough to derail plans for future rate hikes.
- While the market authorities debate whether we are in a recession, it’s more important to review your approach and current position when considering the possible risks ahead.
- From our perspective, it appears that shorter-duration strategies currently offer attractive income while providing the flexibility for managing portfolios in a highly volatile market.
Also included are the following themes:
Economic Vista: Checking the pulse
Jose Sevilla, Senior Portfolio Manager
With summer quickly fading, we thought it would be a good time for a pulse check on the markets. Hopefully, the market’s vitals will improve as we move into the fourth quarter because this year hasn’t been much fun for investors thus far. Equity markets are struggling, with the S&P 500 down approximately 15% and the Nasdaq logging an even steeper 23% decline as of August. And now we’re seeing economic data (Figure 1) that shows slowing US economic activity, including two consecutive quarters of negative GDP growth. US industrial production and Purchasing Manager Index (PMI) data have been declining steadily. And now the housing sector is contracting, clearly affected by higher mortgage rates.
Figure 1: Economic Activity and Yield Curve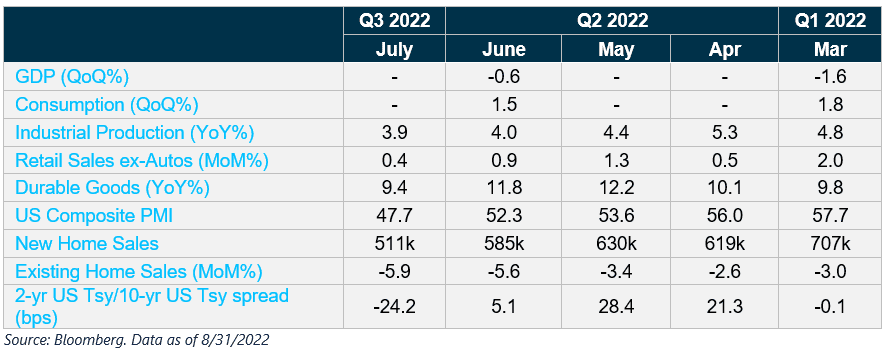
While two quarters of declining GDP is one widely accepted technical definition of a recession, the Federal Reserve is expected to continue on its current monetary policy path. In other words, the Fed is willing to let the US economy contract to ameliorate inflationary pressures, which remain elevated at 8.5% annually, the highest in four decades. No doubt the Fed has a difficult job ahead. Can it bring down inflation near its preferred 2% target without roiling the economy or undermining a solid labor market (Figure 2)?
Figure 2: Inflation and Job Market

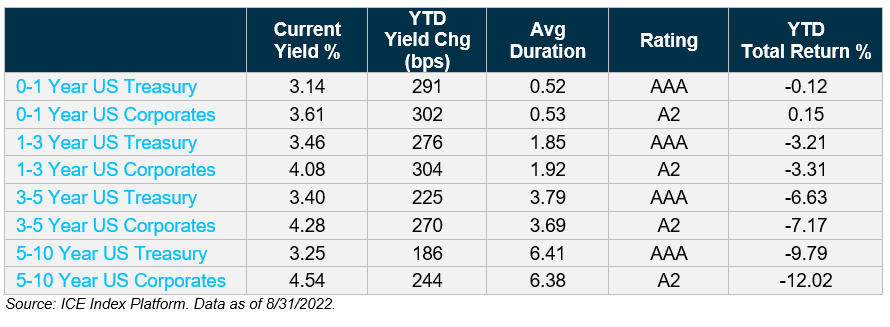
At the time of this writing, the Fed was still expected to raise interest rates by another 100–125 basis points (bps) by the end of 2022. Bond yields have gotten ahead of the Fed, fully pricing in the additional rate hikes, pushing yields to their highest levels since 2007. Of course, all this makes sense, given that the bond market typically anticipates Fed moves long before it actually changes its short-term interest rate. For example, 0- to 5-Year US Treasuries have risen by an average of 260 bps this year (Figure 4). In fact, some experts believe that we are close to the end of the Fed’s tightening cycle and that investors should gradually prepare their portfolios for this eventuality — and possibly even for a recession.
But before debating how to pivot and whether to tilt toward a short- or long-duration strategy, let’s look at the current shape of the yield curve (Figure 3). Given the current Fed policy path, combined with the perception of a slowing economy, we’ve seen a distinct flattening of the yield curve. In other words, there’s not much difference between short-term and long-term yields across much of the curve. In fact, there has been an inversion (whereby shorter-maturity yields are greater than their longer-maturity counterparts) at certain points of the curve.
Figure 3: US Treasury and High-Grade Corporate Curves
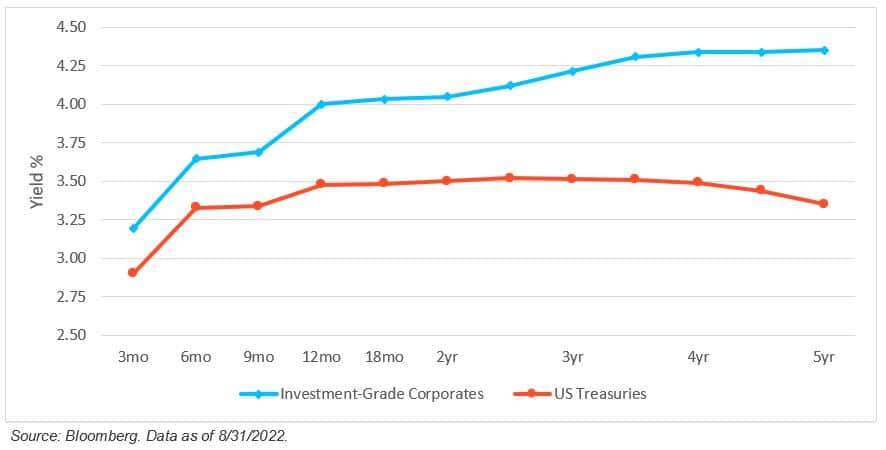
Investing in this current environment (and especially anticipating what’s to come) hinges on an investor’s risk-reward profile and liquidity preferences. This requires a close examination of the trade-offs between potential returns and duration. Recall, duration is simply a measure of how the price of a bond changes in response to changes in interest rates — the longer the duration, the greater level of interest rate risk.
Year to date (YTD), shorter maturities have outperformed their longer-maturity counterparts in the current environment of rising rates, and investors are getting compensated more for the duration risk they are taking in the short end of the curve compared to the long end.
Figure 4: Short- vs. Long-Duration Strategies
Nevertheless, uncertainty remains high. Thus, we continue to pay close attention to the higher-rate, higher-inflationary environment, as well as the possibility of an economic downturn. And given the Fed’s hawkish stance and the current interest rate volatility, it may be premature to add duration at this point.
To summarize, we believe short duration investments are still prudent, which will help reduce interest rate risk while generating competitive returns. Today’s higher yields on short-dated securities may provide an opportunity for attractive income with lower volatility and less interest rate sensitivity. That’s where we are focused for the moment. As always, we continue to advocate for a disciplined approach to credit selection in these uncertain times, focusing on high-quality bonds with strong corporate fundamentals as a means to mitigate portfolio volatility.
Credit Vista: Repos in review
Darrell Leong, CFA, Managing Director, Head of Investment Research
In September 2013, the Fed became the repo man, but in a good way. That’s when the Fed created the reverse repurchase (RRP) facility to prevent short-term rates from trading below desirable levels. As the Fed was embarking on quantitative easing — a monetary policy tool whereby the Fed purchases securities on the open market — the Fed was worried that when it came time to raise the fed funds rate above zero, rates would not meet targeted levels or maybe even fall negative. The various quantitative easing programs that have since been launched by the Fed have driven significant amounts of liquidity into the short-duration markets, including money market funds. This, in turn, has heightened liquidity at the very short-duration segment of the market.
So how exactly does all this work? An RRP agreement — often called reverse repos in the financial media — is a transaction where one party (typically a money market fund) purchases a security from another party (the Fed) with an agreement that the second party will “repurchase” it the following day, usually at a slightly higher price to provide the cash provider interest.1 Every day, the Fed accepts overnight cash investments from banks, government-sponsored enterprises — such as the housing agencies and the Federal Home Loan Banks (FHLBs) — and money market mutual funds. In return, the Fed provides Treasury securities as collateral at its Overnight Reverse Repurchase Agreement facility. All these transactions are largely behind the scenes and invisible to most of us, though they play an important role in lubricating the financial system and making sure things are running smoothly.
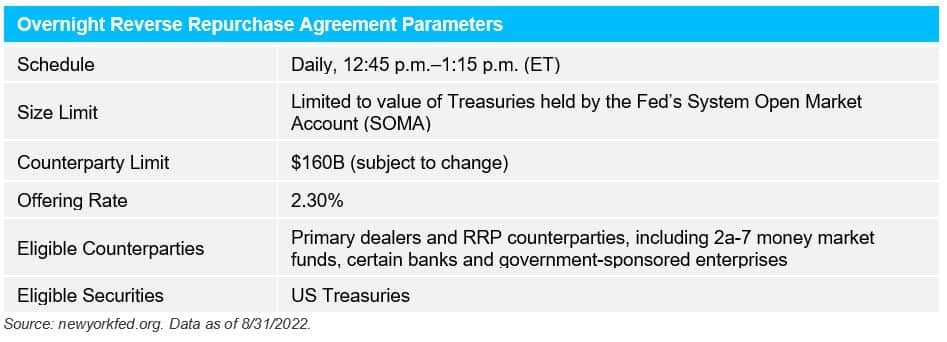
Despite the fact that the overnight RRP facility is officially a temporary policy, it’s been around for nearly a decade now, and is once again proving to be a valuable tool to help the Fed control the fed funds rate. For investors, overnight RRP is used when other money market investment alternatives — such as bank deposits or Treasury bills — are unavailable or unattractive. Money market funds are the largest users of the RRP, currently holding about 90% of total RRP balances.
Why is this so important? Overnight RRP helps provide a floor under overnight interest rates by acting as an alternative investment for a broad base of money market fund investors. By increasing the RRP rate, the Fed would drain cash out of the banking system when deposit rates are too low. Placing funds with the RRP facility at the Fed is essentially the same as a deposit. The facility effectively extended the authority of the Fed to pay interest on reserve balances (IORB) to a broader set of counterparties.
As of August 31, 2022, the Overnight RRP rate was 2.30%, representing one of the most attractive investments for money market funds. Since early 2021, the RRP balance has expanded rapidly to $2.25 trillion.
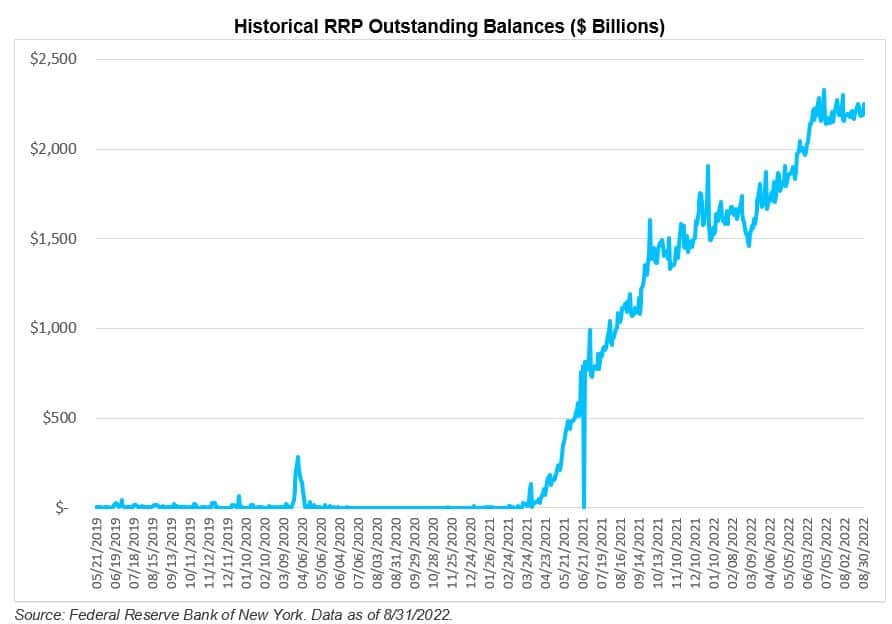
1. Source: https://bpi.com/the-overnight-reverse-repurchase-facility/#_ftn4
Temporary or Permanent?
At this point, many investors are wondering when RRP usage will slow, if ever. That all depends on front-end supply because the current demand for cash overwhelms supply. Higher US Treasury bill supply would be the most direct way to drain the overnight RRP facility, but it is not the only path. Increases in bank certificate of deposit (CD) or commercial paper issuance would also attract investors to reallocate out-of-bill holdings to capture higher rates. This, too, will free up Treasury bill supply for RRP.
So what’s next for the Fed, which insists the RRP is a temporary tool? There are two likely paths to draining cash out of the overnight RRP: 1) lower aggregate or per counterparty caps (currently at $160 billion/fund) or 2) lower RRP interest rates. However, the latest Federal Open Market Committee (FOMC) minutes suggest a willingness to increase overnight RRP caps to prevent money market rates from falling outside their target range, so this facility looks to be around for a while longer. The Fed also believes the RRP is an important way to encourage more bank funding competition. Bank deposit rates tend to exhibit a greater lag in moving higher when rates are rising. But facing more competition for deposits, the banks will likely pass higher rates to customers more quickly. This eventually will help tighten financial conditions and moderate inflation.
Competition for funds from highly liquid cash investors comes not only from the Fed’s RRP but also from Treasury bills, as noted earlier. Treasury bill rates were attractive on a relative basis to RRP when bond issuance was high. Due to strong federal tax receipts in the first half of 2022, Treasury bill issuance has been low. In the past, Treasury bill issuance has increased when tax receipts come in lower than budgeted or due to a stimulus program, as was the case following the passage of the Coronavirus Aid, Relief, and Economic Security (CARES) Act in March 2020.
After all, many investors who seek highly liquid alternatives do not want to take on longer duration while the Fed continues its sizable rate hikes. At the moment, the RRP remains a lucrative investment that provides money market funds with a higher return and a desirable overnight maturity compared to other cash-like alternatives. This type of repo man is one of the good guys!
Trading Vista: Hike and hold
Jason Graveley, Senior Manager, Fixed Income Trading
Treasury yields soared to fresh multiyear highs in August, with the 2-Year Treasury moving to its highest yield since 2007 as the month came to a close. Like many of the other shifts in rate expectations this year, recent Fed commentary has maintained a generally hawkish tone and has been the driving catalyst of the recent rise. Fed officials have been uniform in their messaging, which seems designed to push back on the narrative (or perhaps wishful thinking) for rate cuts as early as 2023. The hope for a quick end to the rate hike cycle had been muddying the outlook for how long the higher-rate environment would last. Although uncertainty and volatility are sure to persist, the trajectory of rates will depend on the “totality” of the upcoming economic data. Chairman Powell provided a forceful reminder of this at the Fed’s annual policy forum in Jackson Hole, where he stated that “restoring price stability will likely require maintaining a restrictive policy stance for some time.” That sounds like hike and hold for now.
The recent move in rates has been reflected in a steady march higher throughout last month, with each point on the front-end Treasury curve markedly above July’s closing yield. The 3-Month, 6-Month, 1-Year and 2-Year Treasury yields have jumped 55, 50, 58 and 63 bps, respectively. This also coincides with a net increase in bill supply for the month, where the market saw $240 billion in additional issuance. Although this is not a blowout increase in supply, it is a welcome contrast and largely offsets the YTD contraction of more than $250 billion. This increase is also expected to extend into the fourth quarter, when strategists are calling for an additional net positive issuance of $150 billion. And while supply will remain positive through the rest of the year, demand should also remain strong and even increase as well.
Overall, the market has seen a flattening of the Treasury curve since Powell’s Jackson Hole remarks. The highest Treasury yield remains the 3-Year, and the curve is largely inverted beyond that point. Although the market is split on the magnitude of the September interest rate increase (between 50 and 75 bps), the pace of further hikes after September is expected to slow. Current calls are for a more modest 25 bps at both the November and December meetings. As the pace of expected hikes slows, demand for Treasury bills should jump as both investors and money market funds look to extend duration. The weighted average maturity (WAM) of money market fund complexes will increasingly be in scope. Government money market fund WAMs have fallen from an estimated 45 days at year-end to roughly 15 days today. When these funds elect to invest more fully into the bill market, there should be a corresponding decline in the Fed’s RRP facility balance, which currently sits at an elevated $2.25 trillion. In the meantime, the market’s gaze will be squarely on economic data and the parsing of subsequent forward guidance from the Fed, just to see if any other near-term shifts are likely. We’ll be watching and listening too.
Markets |
|||
|---|---|---|---|
| Treasury Rates: | Total Returns: | ||
| 3-Month | 2.32% | ICE BofA 3-Month Treasury | 0.16% |
| 6-Month | 3.33% | ICE BofA 6-Month Treasury | 0.15% |
| 1-Year | 3.48% | ICE BofA 12-Month Treasury | -0.23% |
| 2-Year | 3.49% | S&P 500 | -4.07% |
| 3-Year | 3.52% | Nasdaq | -4.52% |
| 5-Year | 3.35% | ||
| 7-Year | 3.31% | ||
| 10-Year | 3.19% | ||
|
Source: Bloomberg and Silicon Valley Bank as of 08/31/2022. |
|||


