

- Commercial card KPIs enable you to quantify the financial returns, efficiency gains, and cost savings of your card program.
- Card program metrics reveal critical insights for optimization decisions, including average transaction values, rewards yield, monthly savings rates, and per-card benefits.
- Corporate card ROI measurement demonstrates sustainable growth advantages to your C-suite and board members, while identifying opportunities for optimization.
Many venture-backed growth companies manage runway using commercial cards to control expenses such as SaaS, supplies, shipping and travel. But it’s also important to measure the tangible ROI your card program delivers, and how you can optimize beyond that.
Corporate card KPIs enable CFOs and finance teams to quantify critical value drivers like financial returns through rewards and cost-saving efficiencies from automated workflows. Here we’ll look at four card metrics that help you demonstrate practical impact to your executives, board and investors. These insights may also identify opportunities to expand your card program to capture even more value.
4 commercial card metrics for measuring ROI
First, you want to understand usage patterns in your commercial card program. Measuring Average Transaction Value (ATV) identifies spending trends in terms of high or low dollar purchases. For example:
- High ATV indicates your teams use cards primarily for big expenditures like cloud infrastructure or major equipment. One way to optimize is expanding corporate card usage to cover day-to-day expenses for business travel and employee stipends. It increases rewards yield and automated efficiency to add more ROI.
- Low ATV typically indicates frequent small purchases like office or lab supplies. It signals opportunities to consolidate spending with fewer vendors and negotiate company contracts for better rates.
This metric can also show if there’s seasonality to your spend; for example, staff using the card during a busy Fall conference season. Ultimately, what you’re hoping to see over time is steady growth in Average Transaction Value as more vendors become part of your card program. In turn, you may see a steady rise in your cash back yield (which we’ll talk about next).
And one other critical consideration? Expense reporting can take just as much time to process one small transaction as one big one. If you have many transactions every month and you’re not automating expense reporting – that’s a costly inefficiency you want to solve right away.
Rewards Yield
Rewards Yield measures the financial gain in cash back earnings from your card spend. Rewards or revenue share directly enhance your cash flow, and the rewards yield KPI can reveal insights for further optimization.
For example, are you leaving money on the table by paying vendors via check or ACH? It may be time to engage frequently used suppliers to accept card payments. If you’ve been paying for SaaS subscriptions or cloud infrastructure using different cards, consider consolidating payments on a single corporate card. These strategies pay you back twofold. It scales up your cash back yield, while simplifying payments and reconciliation for your supply chain.
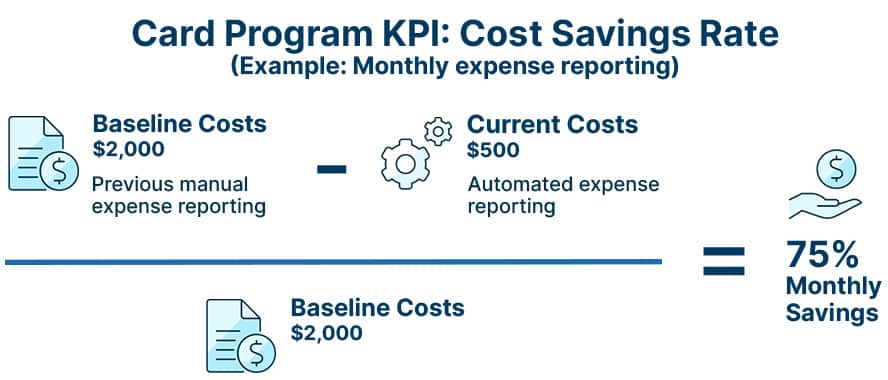
Cost Savings Rate
Cost Savings Rate (also called Program Savings Rate) is a corporate card KPI that quantifies efficiency gains from automation in concrete dollars or percentages. It demonstrates that your card program is reducing operational costs, while enabling teams to scale productivity.
The trick here is to establish a baseline. We recommend using a before-after analysis, comparing the time expended for manual vs. automated processes. You then apply the hourly rate salary equivalent to those timing benchmarks. For example, consider manual expense reporting. How much time did it take to manually process 50 expense reports? Include employee time spent compiling and submitting notes and receipts, then finance staff processing and reconciling to your ledger. Then how much faster are you managing it all with automation? And what is the salary equivalent of that time?
Using that example, here’s how to calculate Cost Savings Rate: Previously, processing 50 expense reports required 30 hours monthly at $2,000 employee cost. Using automated expense reporting and reconciliation (like with SVB’s platform), the same 50 reports require only 7 hours at $500 monthly cost, delivering substantial time and cost savings.
We see clients use a similar approach to quantify the financial impact of efficiency gains, like closing monthly books faster. Using the same formula, you can look at the time (and related salary cost) before your optimized card program and after. For example, automating workflows simplifies accounting and reduces errors, which can shorten monthly close from weeks to a couple days. And that translates into real financial benefits.
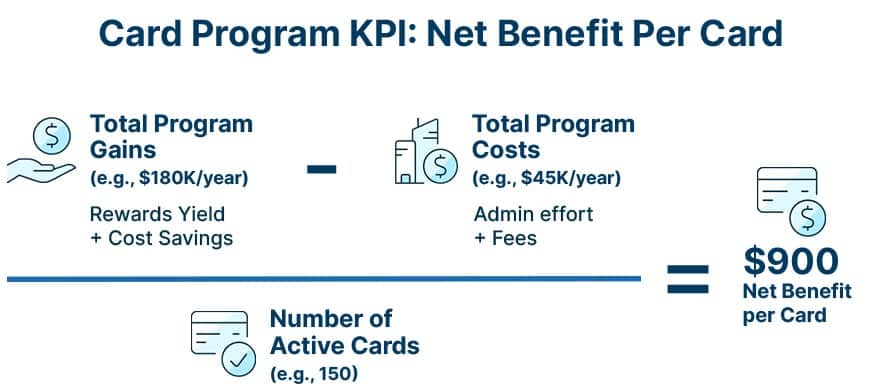
Net Benefit Per Card
Once you’ve measured earnings and savings, you’re ready to track individual card ROI. Net Benefit Per Card combines Rewards Yield and Cost Savings Rate to help uncover optimization opportunities.
High per-card benefit may justify expanding your card program to more employees or issuing more purpose-specific virtual cards. Low per-card benefit could signal low adoption or low utilization, such as teams still paying vendors with checks. It’s an opportunity to engage your top suppliers to accept commercial card payments, which can benefit both your business and your vendor relationships.
Try this formula for measuring Net Benefit Per Card:
These four commercial card KPIs enable you to demonstrate ROI to your C-suite executives, board members, and investors. It’s a valuable framework to quantify how your card program is empowering sustainable growth.
Ready to optimize your commercial card ROI? Learn how SVB commercial cards and AI-powered spend management can help technology companies and life sciences firms maximize cost-efficiency, rewards revenue, and cash flow optimization.
FAQs
What's a good benchmark for Average Transaction Value?
An Average Transaction Value of $150-300 is a good benchmark for fast-growth companies. Above $300 may indicate bulk purchases from consolidating vendors or using the commercial card for high monthly expenses like cloud infrastructure. Below $100 often signals many small, ad-hoc purchases, which could mean missed economies of scale that should be addressed to lower costs.
How often should we measure these commercial card metrics?
Run these corporate card metrics monthly to spot trends and do a deeper analysis quarterly to make strategic adjustments to your card program. In particular, Average Transaction Value and Rewards Yield can help you make monthly decisions for finance operations, while Cost Savings Rate and Net Benefit Per Card are valuable for quarterly board reporting.
Which card metric is most important for demonstrating ROI?
To demonstrate corporate card program ROI, Net Benefit Per Card is your strongest metric. It shows the dollar value each card generates in rewards yield and cost-saving efficiencies, while accounting for admin costs. That gives you a concrete way to prove the value to key stakeholders and justify budget allocation and card program expansion.
