Key Takeaways
- Bond yields have reached multiyear highs, having risen in sympathy with the Federal Reserve’s torrid pace of rate hikes. Front-end fixed income yields sit at levels not seen since 2007.
- By all accounts, today’s investors are being well compensated in the form of income return (i.e., carry) unlike any time in the past 13-15 years.
- Although uncertainties persist regarding monetary policy and where interest rates will top out, the outlook for bond market total returns in 2023 has significantly improved.
This month’s main article, The Case for Carry in 2023, discusses that although the future path of inflation and rate hikes is uncertain, there are several bright spots for fixed income investors as we look ahead in 2023.
Also included are the following themes:
Economic Vista: The case for carry in 2023
Steve Johnson, CFA, Portfolio Manager
No rest for the weary, at least according to the Federal Reserve‘s constant messaging. After raising rates at a blistering pace in 2022, the Fed looks poised to continue its rate-hike campaign into at least part of the New Year. Paired with a 50-basis point (bps) hike at its December 2022 meeting — bringing the fed funds rate to a range of 4.25%-4.50% — the Fed’s “dot plot” (a graphic that shows Fed committee members’ expectations for future interest rates) suggests that rates would reach 5.125% by year-end 2023.1 Importantly, only 10 of the 19 Fed members’ individual projection was exactly 5.125%. Two members projected the policy rate to rest at 4.875% by year-end 2023, another five projected rates would rise to 5.375% and two others penciled in needing to take the policy rate all the way to 5.625%. Clearly, uncertainty about the future path of inflation is eliciting a range of opinions and views from Fed members. Although this makes it tricky for fixed income investors as we head into 2023, we see three reasons to be optimistic in the New Year:
1. Bond yields have reached multidecade highs. Having risen in sympathy with the Fed’s torrid pace of rate hikes, front-end fixed income yields now sit at levels not seen, in many cases, since circa 2007. A range of short-duration bond index yields ended 2022 at approximately 13- to 15-year highs, representing the mid-80th percentile of yields available to investors since the turn of the century.2

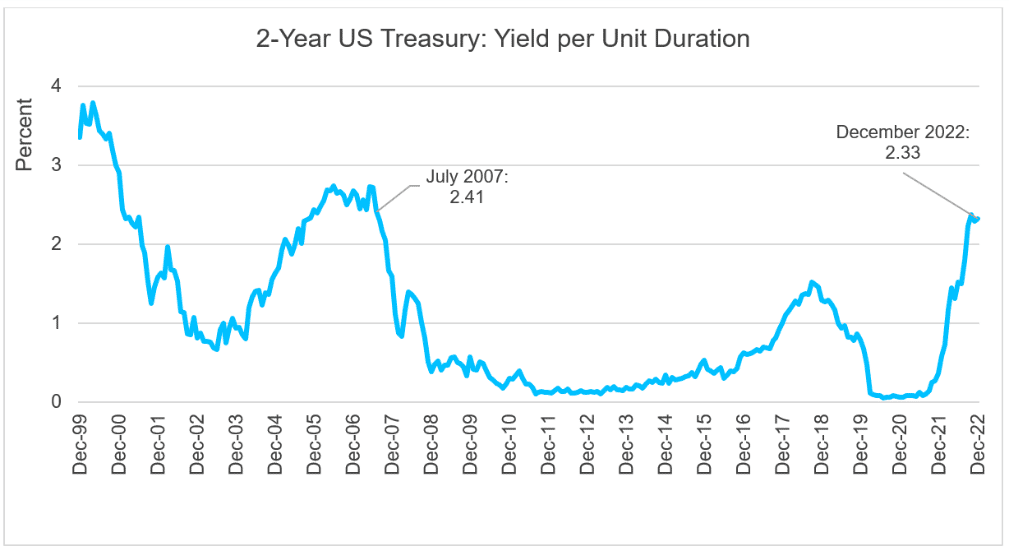
2. At these elevated yield levels, the income (or “carry” as bond investors refer to it), generated from bond portfolios has the potential to be significantly higher than any point over the past decade. Investors willing to modestly take on duration can now lock in competitive levels of income for multiyear and/or full cash runway horizons. Gone (for now at least) is the low-income and zero-rate environment of the 2010s. For example, at year-end 2022, 2-Year Treasury investors were compensated with about 2.33 times the yield (4.4% as of December 31, 2022) for every effective duration year (2-Year Treasuries had a 1.89-year effective duration as of December 31, 2022). That yield-to-duration ratio, a high since July of 2007, also sat in the 86th percentile when considering the ratio’s history all the way back to 2000 (remember the Y2K concerns?). The same phenomenon exists across much of the short-duration landscape, proving investors are now, more than in recent years, being rewarded with elevated income for taking on duration.

3. Lastly, the outlook for bond market total return in 2023 has significantly improved. A bond (or portfolio’s) total return considers not only the carry generated (the “income return”), but also the change in market value of bond holdings (the “price return”) as they fluctuate with interest rate changes. Adding income return and price return together gives an investor a sense for the “total” return earned on a bond position or portfolio. Importantly, when income returns are elevated (as in today’s environment), bond prices must fall significantly for total return to break into negative territory. Because bond yields and prices move inversely, yields must rise much more than in a comparatively low-yield, low-income environment for prices to drop enough to overcome a higher level of income.
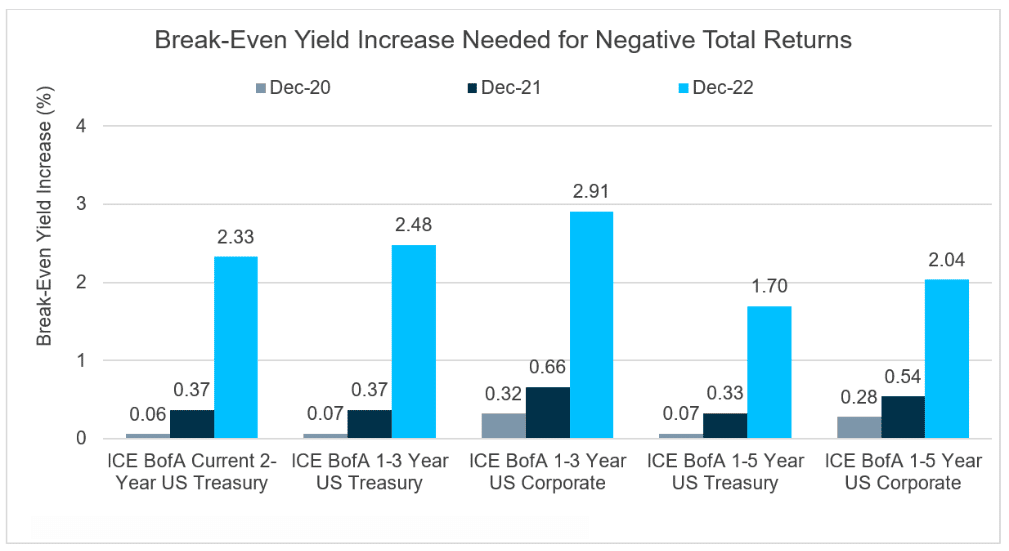
Consider this example5: At year-end 2020, the 2-Year Treasury yielded 0.12% and had an effective duration of 1.99 years. Over the course of 2021, 2-Year Treasury yields increasing by just more than ~0.06% would be enough to turn total returns negative for the year (very low income generated by the bonds could be easily offset by even slightly negative price action). Fast-forward to year-end 2021, the 2-Year Treasury had risen to 0.73% and then had an effective duration of 1.98 years. At that point, 2-Year Treasury yields rising by just more than ~0.37% would drag the total return into negative territory for 2022. In stark contrast, however, year-end 2022 told a different story. The 2-Year Treasury yield ended at 4.4% and had an effective duration of 1.89 years. At that level, it would require bond yields increasing another ~2.33% for a 2-Year Treasury buyer to have a negative total return in calendar year 2023.
So what is the key point here that we are trying to hammer home? Said another way, higher levels of carry (i.e., today’s environment) should more than compensate for any further near-term price declines. Thus, the opportunities for bond investors, especially with regard to reinvestment opportunities, is far more encouraging at today’s yields. This applies across the short-duration fixed income landscape compared to recent years, where such “break-even” yield increases have risen significantly.
While the uncertainty around the Fed’s campaign against inflation continues, what is certain is today’s environment for fixed income investing has drastically changed when compared to recent years. With yields at multiyear highs and the corresponding elevated carry potential, the total return environment has improved. This leaves us quite constructive on the short-duration space for 2023.
Credit Vista: No mercy needed
Tim Lee, CFA, Senior Credit Analyst
Are investors in credit card asset-backed securities (ABS) about to cry mercy given the seven interest rate hikes they’ve endured over the past 10 months? One might think there’s trouble ahead, but upon closer inspection, the ABS niche looks well positioned and should have the stamina to weather the uncertainties of 2023.
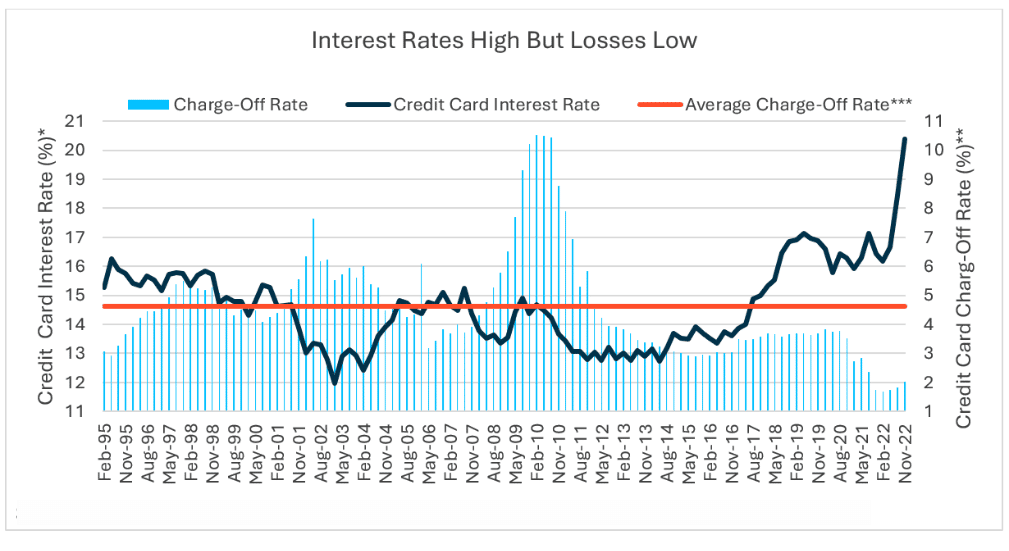
Consider what has transpired over the past year. Since March 2022, the Federal Reserve’s aggressive actions to fight inflation have consequently lifted the lifted the Prime Rate—the common interest rate used to set the annual percentage rate (APR) on credit card accounts—by a whopping 425 basis points (bps). As a result, the interest rate faced by those carrying balances is the highest in at least 25 years. With at least one more (maybe several) interest rate hikes ahead, credit card account holders are likely to face even higher interest rates soon. As rates move higher, could that cause a large wave of account holders to default because of their monthly payments?
*Federal Reserve commercial bank interest rate on credit card plans for accounts assessed interest. As of 11/30/2022.
**Federal Reserve commercial bank charge-off rate for credit cards, seasonally adjusted. As of 09/30/2022.
***25-year average of Federal Reserve commercial bank charge-off rate for credit cards, seasonally adjusted. As of 09/30/2022.
According to data released in January 2023 by the Fed, the average credit card interest rate on accounts had risen to 20.4% by the end of November 2022, an increase of nearly 400 bps from just a year earlier. Yet, losses on credit card accounts sit at historically low levels. The charge-off rate on credit card accounts at commercial banks had increased only nominally to 2.02% as of the end of September 2022, compared to the all-time low level of 1.68% reached in the quarter before the Fed started raising interest rates. Moreover, the charge-off rate remains well below the long-term average of 4.61%.
*Average base case charge-off expectations for each constituent index trust from one of Fitch, S&P or Moody’s.
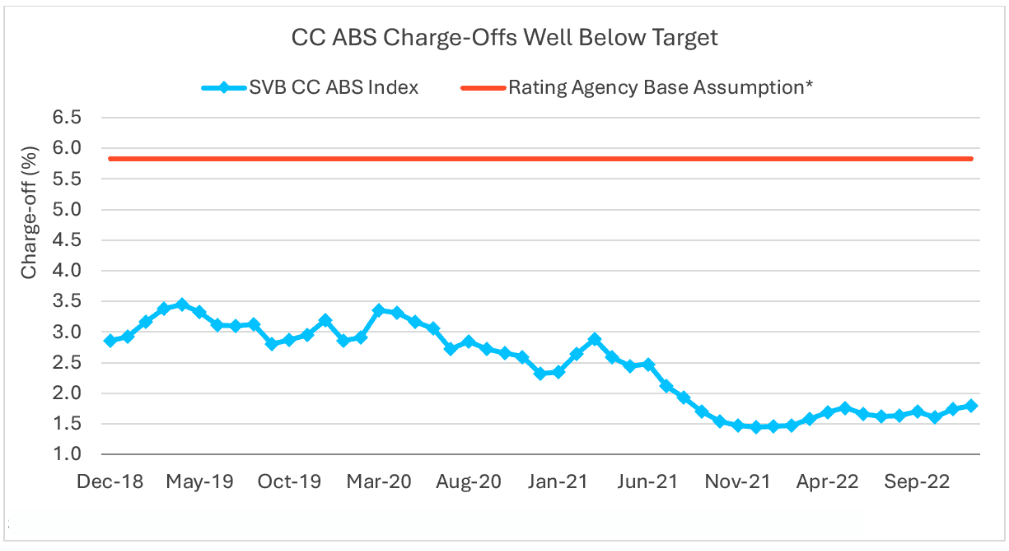
Accounts backing credit card ABS (“CC ABS”) are in even better shape. The average charge-off rate, based on the SVB Credit Card ABS Index6 for these accounts sits at 1.79% as of the November 2022 collection period, which was 23 bps below the charge-off rate of generic commercial bank credit card accounts. Charge-offs continue to sit at levels well below base-case assumptions of the major rating agencies. Charge-offs dipped to historically low levels during the pandemic, as movement restrictions depressed usage. Limited travel, entertainment, and shopping opportunities also helped many households shore-up their balance sheets and build up savings. As consumer activity continues to normalize and credit card usage returns to pre-pandemic trends, we look for charge-offs to rise from the abnormally low levels to pre-pandemic nominal levels. However, even if interest rates and unemployment levels move significantly higher than expected over the next 18 months, we expect to see charge-off rates from accounts collateralizing CC ABS remaining well below the average base-case target level assumed by the rating agencies.
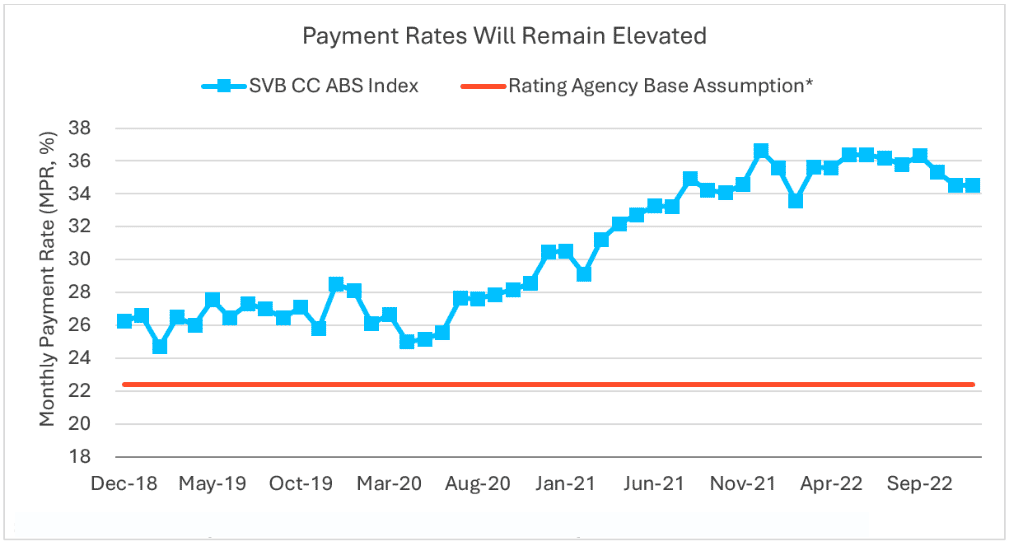
*Average base case charge-off expectations for each constituent index trust from one of Fitch, S&P or Moody’s.
This optimism is based, in part, on our expectations that credit card accounts backing CC ABS will continue to use their cards more for convenience rather than borrowing purposes, as exemplified by climbing payment rates. Higher monthly payment rates indicate increasing numbers of accounts that are repaying their full balances, or close to their full balances, each month as their statement arrives. Such card holders are likely spending cash they already have or reasonably expect to have and thus are using their credit cards as an alternative to carrying cash or, in some cases, simply to earn rewards. For internet purchases, credit cards are used when cash just isn’t a choice. As credit card transactions are increasingly used for non-borrowing purposes, we see decreasing probabilities of widespread default incidents and therefore lower levels of charge-offs.
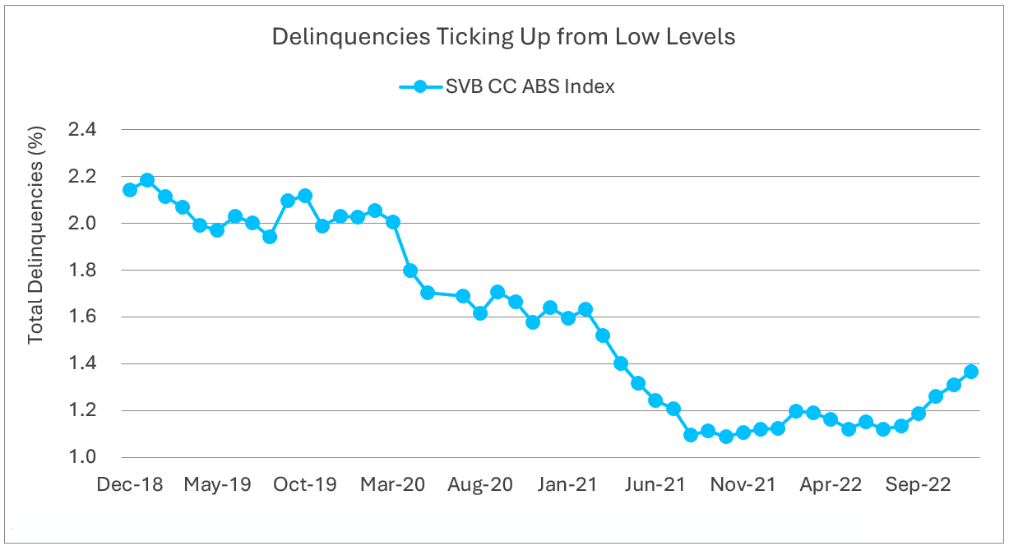
Nevertheless, the accumulating effects of interest rate hikes, price inflation and a receding of household savings built up during the pandemic will weigh on credit card account performance. Into the end of 2022, delinquencies of 30 days or more have begun to move up from historically low levels. If unemployment levels also move up, we expect delinquencies to inch back toward pre-pandemic levels over the next 12 months, indicating that future charge-offs will also inch higher.
Underlying CC ABS Accounts Are High-Quality and Well-Aged

While we expect CC ABS credit performance to soften a bit from the very strong levels experienced during the pandemic, we believe the impact will be marginal. This is primarily due to characteristics of the credit card accounts collateralizing CC ABS. Most receivables are from prime quality account owners. On average, 90% of outstanding receivables have an account holder with a FICO score greater than 660, and two-thirds have FICO scores greater than 720. In addition, nearly all accounts on average have been opened for at least 60 months. In some cases, the average account age runs as high as 22 years. These older accounts indicate that the card holders have been successful in servicing their balances for an extended period. Virtually all these accounts have survived the COVID-19 pandemic, and some have even weathered two prior US recessions. We look for CC ABS investors to benefit from these high-quality and experienced credit card account holders, who are unlikely to cry for mercy under the weight of higher interest rates.
Jason Graveley, Senior Manager, Fixed Income Trading
December closed out what might only be described as a capricious year. Given all the volatility and twists and turns, we’d be remiss if we didn’t take a step back to reflect on the market dynamics and how they might shape investors’ 2023 expectations.
There were ample challenges for fixed income investors this past year, as markets faced multidecade highs in inflation and an embattled Fed committed to bringing it back to its preferred target of 2%. To do so, the Fed launched its most aggressive rate-hiking cycle in recent history, increasing the top end of the fed funds target range from 0.25% in January 2022 to 4.5% after the December Federal Open Market Committee (FOMC) meeting. With low bond coupons to offset the precipitous drop in prices amid rising yields, some global fixed income indices have seen losses surpass 15% in 2022. Fortunately, we don’t anticipate a repeat performance. The playing field has been reset as the surge in inflation appears to be receding, and benchmark interest rates are at their highest level since 2007. So, what’s next?
The primary market is a good place to take stock. As the forward path of rates becomes clear and volatility begins to subside, new deals should come more frequently as they tend to price when markets are stable and investors are, consequently, more eager for risk assets. We weren’t surprised to see nearly 20 borrowers storm the primary market on the opening day of 2023 trading, and we expect that overall 2023 issuance will be slightly higher than last year. For perspective, volumes in the primary market were approximately 16% lower in 2022 compared to 2021. Of course, the headwinds of geopolitical turmoil and monetary policy uncertainty won’t disappear overnight, but these risks seem to have been socialized and look less daunting heading into 2023.
But nothing is ever certain for fixed income investors, and one point of current dislocation in the markets is the possibility of rate cuts. Financial markets are currently aligned with the Fed’s messaging on the near-term expectation of rates; however, this begins to diverge as the calendar moves into the latter half of the year. The Fed has been pushing its message of “higher for longer,” while the Treasury yield curve is showing the 6-month bill as the highest yielding point and then steadily declining into the 10-year bond. For context, the current yield on the 6-month bill was approximately 4.76% in early January, while the 12-month bill and 2-Year Treasury note were yielding 4.66% and 4.36%, respectively. If the market is ultimately forced to move toward the Fed’s view, investors should expect a choppy reset.
Perhaps beyond all else, investors should appreciate how far yields have come in such a short period of time. We previously pointed out how quickly this rate-hike cycle materialized compared to the totality of moves from 2004 to 2006. The 2-year Treasury note, considered most sensitive to shifts in monetary policy, has moved from 0.76% to 4.36% at the time of this writing, with a high-water mark of 4.76% in November. Those are stunning — even historic — moves. And despite the volatility and pain in getting here, investors now have the opportunity to build a portfolio of highly rated fixed income instruments that yield between 4.0% and 5.0% on average, while still providing duration flexibility. A defensive duration stance through 2022 has also left many portfolios well positioned to capture higher yields through reinvestment. Thus, from our viewpoint, 2023 presents a compelling opportunity for investors to capture elevated yields and flip the script from 2022.
_____________________
1https://www.federalreserve.gov/monetarypolicy/files/fomcprojtabl20221214.pdf.
2Using monthly observations. Sources: ICE, SVB Asset Management from 12/31/1999 to 12/31/2022.
3As of 12/31/2022.
4Source: ICE and SVB Asset Management: 12/31/1999 to 12/31/2022. Uses monthly observations.
5These examples are approximations assuming calendar-year income return equal to yield and price return equal to: (-duration) x (change in yield). Coupon reinvestment assumptions and convexity for the sake of illustrating are ignored. For illustrative purposes only.
6Constituents in the SVB CC ABS Index are: AMXCA (American Express Credit Account Master Trust), BACCT (BA Credit Card Trust), CCCIT (Citibank Credit Card Issuance Trust), CHAIT (Chase Issuance Trust), COMET (Capital One Multi Asset Execution Trust), DCENT (Discover Card Execution Note Trust), DROCK (Barclays Dryrock Issuance Trust), SYNCT (Synchrony Credit Card Master Note Trust), SYNIT (Synchrony Card Issuance Trust). Index is equal-weighted, and data is sourced from SEC trust filings.
7Percent of total receivables from an account with credit score above 660.
8Percent of total receivables from an account with credit above 720; above 700 for AMXCA.
9Percent of total receivables outstanding from accounts open for over 60 months.
10In months, data only where disclosed.
11Consumer accounts only.
12Sources: https://www.usinflationcalculator.com/inflation/historical-inflation-rates/
https://www.federalreserve.gov/monetarypolicy/openmarket_archive.htm
http://www.fedprimerate.com/fedfundsrate/federal_funds_rate_history.htm
https://www.bloomberg.com/markets/rates-bonds/bloomberg-fixed-income-indices
https://www.bloomberg.com/news/articles/2022-12-11/fed-message-that-rates-will-spend-some-time-on-hold-clashes-with-rate-cut-bets?leadSource=uverify%20wall
Markets |
|||
|---|---|---|---|
| Treasury Rates: | Total Returns: | ||
| 3-Month | 4.34% | ICE BofA 3-Month Treasury | 0.36% |
| 6-Month | 4.75% | ICE BofA 6-Month Treasury | 0.43% |
| 1-Year | 4.69% | ICE BofA 12-Month Treasury | 0.38% |
| 2-Year | 4.43% | S&P 500 | -5.77% |
| 3-Year | 4.42% | Nasdaq | -8.65% |
| 5-Year | 4.00% | ||
| 7-Year | 3.97% | ||
| 10-Year | 3.88% | ||
|
Source: Bloomberg and Silicon Valley Bank as of 12/30/2022. |
|||


