Key Takeaways
- The pandemic disrupted the automobile industry, but now, as car prices begin to retrench, some investors are wondering if that will impact the outlook and safety of recently issued auto asset-backed securities (ABS).
- While there is always risk of collateral loss, it's important to remember that the AAA-rated ABS are structured to withstand harsh economic and loss scenarios.
- Even under harsh stress test scenarios, we see high-quality, AAA-rated ABS with little risk of principal losses at this time.
Economic Vista: Seatbelts not required for auto ABS
ABS backed by auto loans have come under scrutiny, and some are wondering if there are hidden systemic risks to this fixed income niche. Although the automobile market has hit its share of speed bumps recently, we looked closely at these securities and concluded that the road ahead seems relatively smooth for high-quality auto ABS, even in the face of a potential economic downturn.
Checking Under the Hood
The pandemic sent many markets and supply chains into turmoil, and the automobile industry was knocked out of equilibrium. Demand for automobiles increased as consumers sought out ways to escape their houses with their family and friends, but the manufacturers could not produce enough vehicles as their supply chains were severely disrupted. Limited supply caused new car prices to sharply increase, leading to higher demand and further price increases for used cars.
The consumer price index (CPI) captured the precipitous move in new and used vehicle prices.
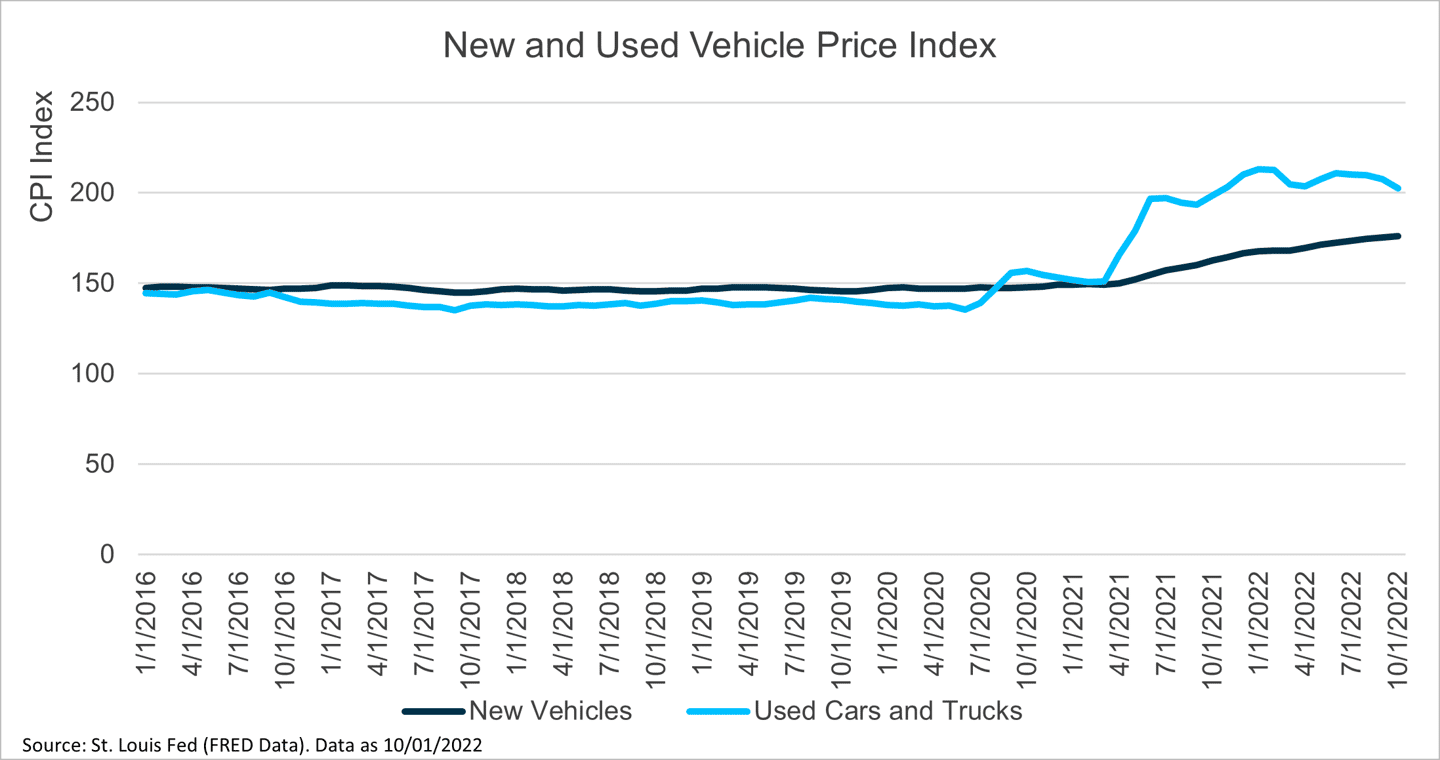
As automobile manufacturers finally catch up with demand and the economy has started to show signs of softening, auto prices have started to decrease. Many investors believe that declining auto prices and weakening economic conditions will elevate risks to ABS, especially those backed by loans that were originated during peak automobile pricing. Some investors may also assume that auto ABS would be at greater risk of falling car prices because investors traditionally securitize a discrete pool of loans that are largely from a single period. Before jumping to conclusions, however, let’s dig into the data. Our focus will be on ABS deals where the majority of loans were originated during a period with elevated prices (and loan sizes). The elevated price and loan dynamic is especially important as those loans could be the most at risk to falling automobile prices.
While there is always some risk of loss to the collateral of the underlying security, it’s important to remember that the AAA-rated ABS are structured to withstand harsh economic and loss scenarios. When banks and issuers create new ABS deals (individual securities are contained within the overall deal), they build in several structural enhancements so the issued securities can achieve a level of safety whereby the rating agencies are comfortable rating the securities in the categories. Some of the most common enhancements include:
- Subordination: Securities or collateral that can absorb losses before senior securities, as senior securities receive principal first and subordinate securities receive losses first.
- Overcollateralization: The issuer includes more collateral than required to support the securities.
- Excess spread: The yield on the collateral within the deal is greater than the weighted average coupon payments on the issued securities. This excess spread can help absorb losses during the period.
- Reserve account: A pool of funds set aside to cover payments in the event there is a disruption in collections from collateral.
- For example, in March 2020, servicers allowed borrowers to pause their loan payments due to the unprecedented COVID pandemic, and despite this pause, no interest payments were missed on prime ABS deals that had reserve accounts.
History Lessons
Given that many high-quality ABS have these guardrails in place, investors should have some additional comfort in the securities. But what can we learn by studying the past performance of similar securities/collateral in various economic periods? Each month, the issuer/servicer provides performance details about all loans outstanding in an ABS deal, including the various stages of delinquency, loans liquidated and prepayments. Investors tend to focus on delinquency and how much was recovered from loans that needed to be liquidated. During periods of economic stress, the market would expect delinquencies and defaults to increase and the value of used cars to fall. The combination of increased defaults and falling car prices (and potentially lower recovery values) can put stress on securities.
When looking back at major prime automobile ABS deals that were issued around the time of the Great Financial Crisis, we can perform stress tests by analyzing default trends and then adding on aggressive loss-rate assumption. The constant default rate (CDR) of deals issued between 2006 and 2010 averaged between 1.0% and 2.15%, with single-month highs of just under 4.0%. The average default rates would be the most logical baseline to use for analysis but using the worst single month as the default rate for the entire life of the security allows for maximum stress.
Defaults are only one leg of the analysis. The loss rate on liquidated collateral is the other important factor. If defaults are very high but little loss is taken on the liquidated assets, the high default rate is not very meaningful. Over the last few years, some ABS deals even experienced gains on liquidated collateral given that used car prices experienced significant growth during the COVID pandemic.
A Severe Stress Test
For comparative purposes, our stress test analyzes a recently issued prime automobile ABS deal from the same issuer that we gathered the representative data from during the Great Financial Crisis. The loans in the deal being stressed were originated in 2020, 2021 and the first half of 2022 during peak car pricing, thus leaving the deal at greater risk to a declining market.
Our base-case default rate for the entire life of the deal initially is the highest single month default rate experienced during the Great Financial Crisis. We then vary the severity rate (the amount of loss experienced on liquidated collateral in a month) to very aggressive levels and continue to increase the default rate until we can find a scenario that would result in a principal loss to the security.
Source: Bloomberg. Data as of 11/30/2022.
Even under these severe conditions, how do these investments hold up? The good news is that even the most exposed AAA tranche in our representative ABS deal was able to easily withstand our aggressive base-case default scenario while also stressing losses on the defaulted collateral to 70%. We then still needed to increase default assumptions until the first principal loss to the tranche was observed. We would expect credit rating downgrades in many of these scenarios, but those triggers are a bit more difficult to model. It’s important to remember that the highest quality issuers did not experience downgrades of their AAA-rated ABS during the Great Financial Crisis.
The bottom line? While automobile prices and the economy may be softening, we feel strongly that AAA-rated auto ABS are structured to withstand some of the most dire scenarios. And even if we were faced with severe economic conditions similar to our base case, we still would be relatively confident in the safety of AAA-rated ABS. No need to deploy the air bags.
Credit Vista: Consumer finance check-up
Fiona Nguyen, Senior Credit Analyst
Back in June, we examined the state of consumer spending and the health of consumer credit balances. But after six more months of aggressive rate hikes and a changing macroeconomic backdrop, we thought it would be a good idea for another consumer finance checkup. After all, the consumer is the largest and arguably the most important component of the US economy.
In our earlier assessment, we found that despite high inflation and negative consumer sentiment, US retail sales were still booming as consumers were tapping into savings and borrowings to maintain their spending. And although credit card balances were rising back in June, deterioration in asset quality was benign. That was then, but what about now? As we are set to close out 2022, where do those metrics stand today?
Recent economic data have shown signs of softness in inflation readings — a welcome surprise. Both measures of inflation — Consumer Price Index (CPI) and Producer Price Index (PPI) — rose at a slower pace in October compared to previous months. Though prices continued to rise, the deceleration suggests that inflation might have moved past its peak. That should be good news for all shoppers.
On the consumer spending front, US retail sales have risen 7.5% year over year (YoY) and hit a new high in October. But adjusting for inflation, real retail sales appear to have plateaued since the peak in 2021 (Figure 1), though this remains higher than pre-pandemic levels. Recent third-quarter earnings commentaries from the financial sector continued to point to elevated spending. Visa, for example, noted that consumers not only spend because of higher prices overall, but the number of transactions in discretionary categories such as travel and entertainment also increased. This echoed the remark from Bank of America, which said spending is up, partly due to inflation and partly due to consumers embracing travel and dining. However, the bank cautioned that spending growth has slowed, and that could be a sign of an impending economic slowdown.
Figure 1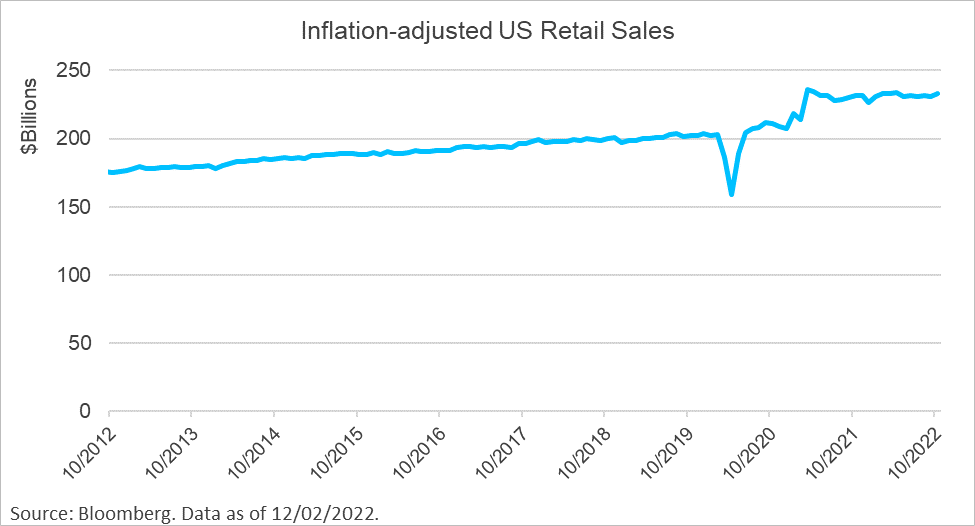
In our view, sustained inflation in the past year has started to erode purchasing power and consumer cash flow. To maintain spending, US consumers continue to borrow more and save less. This is evidenced by the US personal savings rate, which fell further to 3.2% in October from 4.4% six months ago, the lowest reading since the Great Financial Crisis.
Figure 2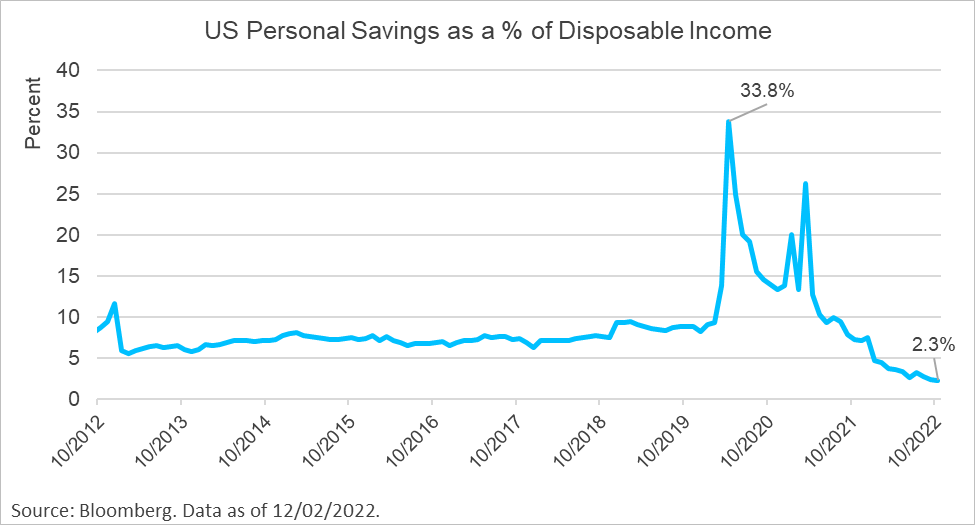
At the same time, consumer credit, including revolving loan balances (such as credit cards) and nonrevolving loan balances (auto and personal loans), has climbed higher and remained elevated (Figures 3 and 4). According to the New York Fed, “credit card, mortgage, and auto loan balances continued to increase in the third quarter of 2022, reflecting a combination of robust consumer demand and higher prices.” However, loan growth in nonrevolving categories such as auto and mortgages is expected to cool as higher interest rates soften demand. On the other hand, credit card balances, which already increased by 15% (YoY) at the end of September, are forecasted to keep growing over the coming quarters.
Figure 3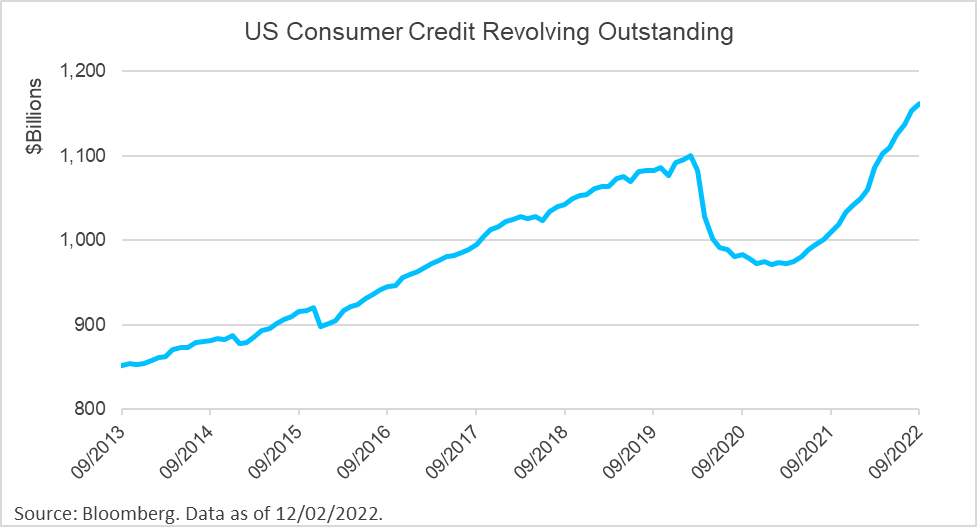
Figure 4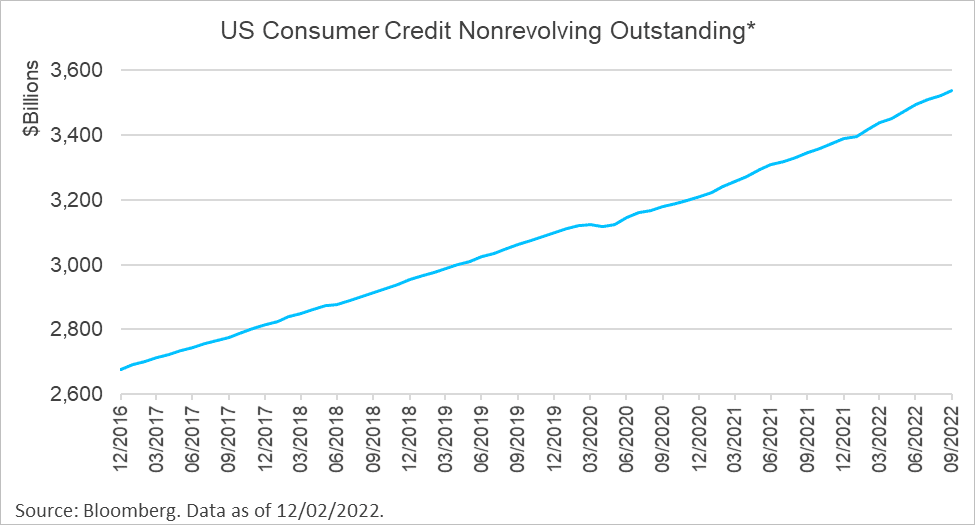
Amidst steady loan demand, it will be important to monitor how lenders prepare for a potential credit deterioration if there is an economic slowdown. The most recent consumer loan Senior Loan Officer Opinion Survey published by the Federal Reserve already showed a significant shift toward banks tightening lending standards for all three consumer asset classes, with material tightening in credit cards. Credit card lenders reportedly imposed tighter terms, such as higher interest rate spreads and limited approvals for certain borrowers.
Persistent inflationary pressure and reduced excess savings have put a squeeze on household budgets, leading to rising delinquencies and eventual credit losses for lenders. In third-quarter earnings, most consumer banks reported increasing early-stage delinquencies in auto and credit card loans. For now, the patterns of increase are widely viewed as a normalization to pre-COVID levels, rather than a material credit reversal. This is consistent with findings from the New York Fed’s latest Quarterly Report on Household Debt and Credit, which assessed that the rate of delinquencies in total household debt has increased compared to last year but was still well below the rate in 2019. Rating agencies keep a close watch on these developments. Moody’s, for example, expects that delinquencies will accelerate past 2019 levels in the first half of 2023 if the unemployment rate rises to 5% (by comparison, unemployment stood at 3.7% in October 2022).
After all that checking, does the consumer still get a clean bill of health? Compared to six months ago, we can say that credit conditions have undeniably weakened at a faster clip in certain consumer pockets. As concerns of economic recession are getting louder, household balance sheets and leverage will be important barometers to follow closely because consumer vulnerability can negatively affect financial performance of various sectors. So, while the strong labor market continues to lend support to asset quality, we believe the current conditions underscore the need for careful credit selection. The consumer still looks relatively healthy, yet we remain cautious that certain issuers with high sensitivity to consumer lending might see more headwinds in 2023.
Trading Vista: Answering the age-old questions
Jason Graveley, Senior Manager, Fixed Income Trading
As we head into year-end, the seasonality of bond flows and questions around liquidity consistently come to the forefront. This year is no different, but dialogue around the issues has been exacerbated by heightened volatility and an aggressive Fed hiking cycle. Although the pace of hikes is expected to slow as the terminal rate — considered the top end of where the market believes the Fed will end its rate hikes — approaches 5%, the timetable to get to this point has no historical comparison. The 2022 hike cycle has been the fastest on record, with the target range increasing more than 400 basis points in nine months. The 2004-2006 hiking cycle achieved a similar increase, but the decisions were spread over two years comparatively1. Navigating this aggressive rate-hike pace has left the market on its heels at times, parsing every economic data point or piece of Fed commentary to stay ahead of a pivot in the cycle. This has led to intermittent spikes in Treasury yields and bouts of volatility across fixed income markets.
Although no market is immune to investor overreaction and swift moves in sentiment, those currently feeling a liquidity pinch are relegated to the longer end of the curve — specifically in 10-year, 20-year and 30-year Treasuries. Front-end technicals are in stark contrast to those in longer duration. The fast boost to investment yields across money markets has drawn more investors off the sideline, enticed by returns not realized since 20071. Thematically, the discussion around too much cash chasing too little supply continues to hold firm. Market participation, particularly when bonds are being sold broadly to the investor community, remains staggeringly deep; it’s not uncommon to see a double-digit number of participants attempting to purchase the same security. As a result, credit spreads in this space have held in well — not quite at their tightest level but a far cry from any levels deemed distressed. And if we compare the spread levels of the Bloomberg Barclays Short-Term Credit Index (<1yr) and the Bloomberg Barclays 1-3 Yr Credit Index to-date this quarter, both indices have tightened from the end of September2.
So how should investors decipher their liquidity concerns as we approach year-end? To answer, let’s first look at Treasuries, which is the most visible market to gauge liquidity. There are different measures within the Treasury market, but ultimately the bid-ask spread is the easiest determinant of overall health. If we look at what it would cost an investor to buy and sell the same security intraday, that spread remains significantly compressed and often within a very tight price range in the Treasury bill market. Separately, conditions are only expected to improve into 2023. Total Treasury bill supply is projected to increase by close to $1 trillion by some analysts’ estimates, while separately investors may look to extend duration as the peak of the rate-hike cycle materializes. Of course, if we see any incremental improvement between supply and demand, it will only serve to ease technical pressures.
Separate from bid-ask, another common measure of Treasury volatility is the ICE BofA MOVE Index. This index tracks the implied volatility in Treasury options and is generally a gauge of what the market expects in price changes over the next month. And while the levels there remain elevated given the monetary policy backdrop, volatility expectations have declined more than 25% from their October peak. Thus, given the tight bid-ask spreads and lower implied volatility, we believe that liquidity concerns — particularly in the front-end of the curve — remain low despite broader market headlines and reports. So, as we approach year-end in what has been a historic year by many measures, the fixed income markets remain relatively healthy in our opinion.
Markets |
|||
|---|---|---|---|
| Treasury Rates: | Total Returns: | ||
| 3-Month | 4.32% | ICE BofA 3-Month Treasury Bill | 0.31% |
| 6-Month | 4.65% | ICE BofA 6-Month Treasury Bill | 0.36% |
| 1-Year | 4.69% | ICE BofA 12-Month Treasury Note | 0.32% |
| 2-Year | 4.31% | S&P 500 | 5.54% |
| 3-Year | 4.05% | Nasdaq | 4.51% |
| 5-Year | 3.74% | ||
| 7-Year | 3.68% | ||
| 10-Year | 3.61% | ||
|
Source: Bloomberg and Silicon Valley Bank as of 11/30/2022. |
|||


