- The K-shaped economy provides a valuable framework for understanding the uneven nature of recent economic performance in the US.
- Higher-income households have benefited significantly from rising financial markets, while lower socioeconomic groups face declining purchasing power and financial stress.
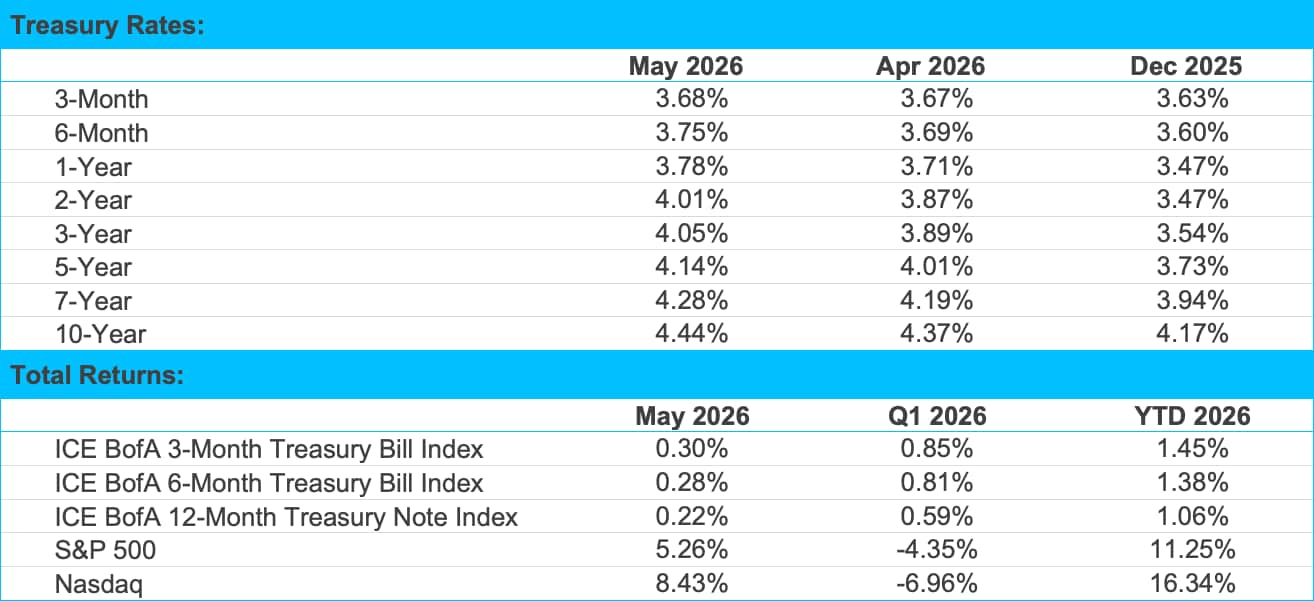
- It’s imperative to look beyond headline data to understand if current economic trends are sustainable and, by extension, how a policy response might impact yields and the overall bond market.
Economic vista: Deciphering the K-shaped economy
Travis Dugan, CFA, Managing Director, Portfolio Management
Economics may be called the “dismal science,” but pundits have come up with an artistic way to describe the current status of our domestic economy. The K-shaped economy largely refers to the uneven trajectory and outlook for our economy – one in which different socioeconomic groups are experiencing divergent outcomes. This phenomenon seemingly became more prominent following the COVID-19 pandemic. Today, it not only continues to describe the modern US economy but also has carryover effects for monetary policy and bond yields.
How the K-shaped economy works
Traditional economic recoveries are often described as broad-based improvements; however, the K-shaped framework highlights a more complex reality in which some groups experience strong growth while others continue to struggle. Understanding this divergence is critical for evaluating near- and longer-term economic performance, as well as for portfolio positioning.
In a K-shaped economy, different parts of the economy move in opposite directions after a recession. One segment – represented by the upper arm of the K – experiences rising incomes, increasing wealth and robust employment opportunities. Meanwhile, another less fortunate segment faces stagnation, declining purchasing power and financial stress. This is represented by the downward-sloping lower leg of the letter K. These differences are often driven by structural factors, such as access to capital, education, job types and ownership of assets like stocks, bonds and real estate. As a result, the economy does not recover uniformly, and inequality widens over time.
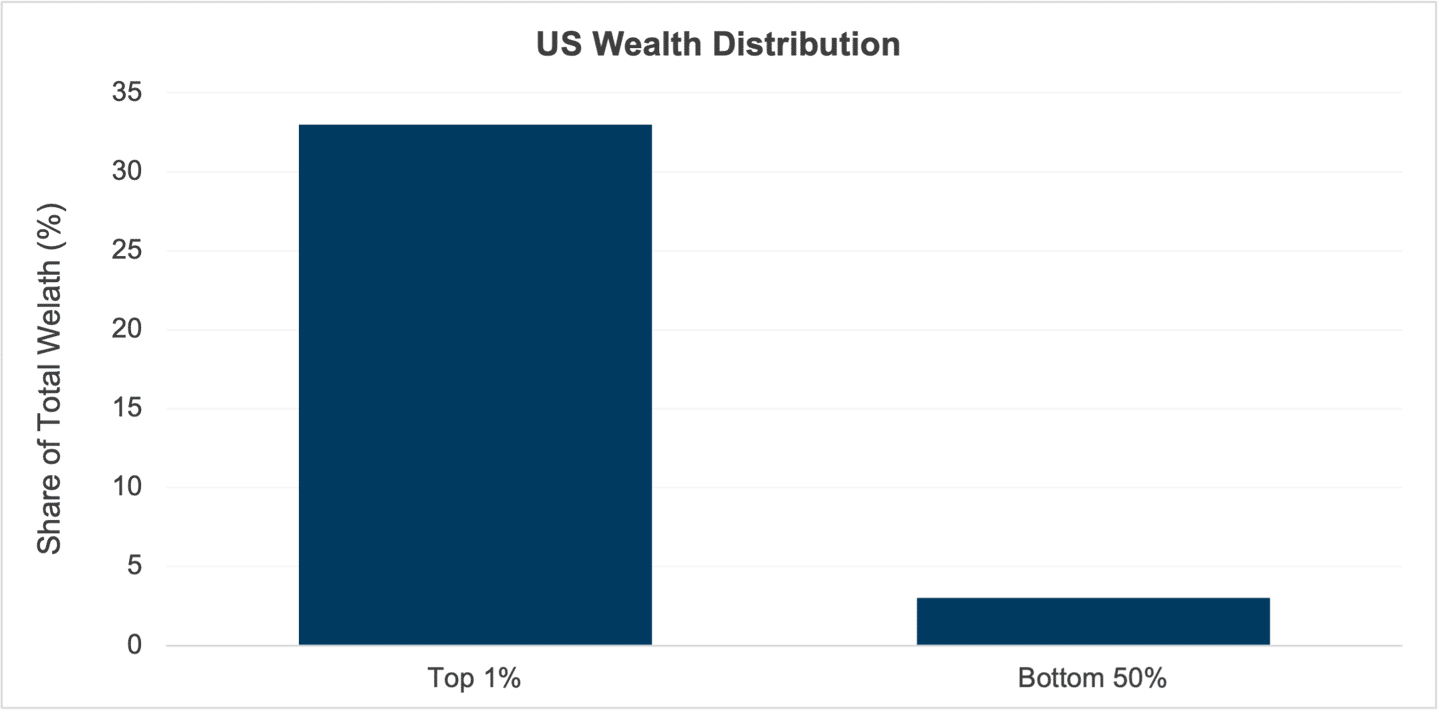
The US economy currently exhibits many characteristics of a K-shaped economy. Higher-income households have benefited significantly from rising financial markets and home values, allowing them to build wealth rapidly. In contrast, lower-income households have experienced slower wage growth, and they are affected more severely by inflationary pressures, particularly in essential goods such as housing, energy and food. This divergence has led to an increasingly uneven distribution of economic gains.
Ramifications for consumers
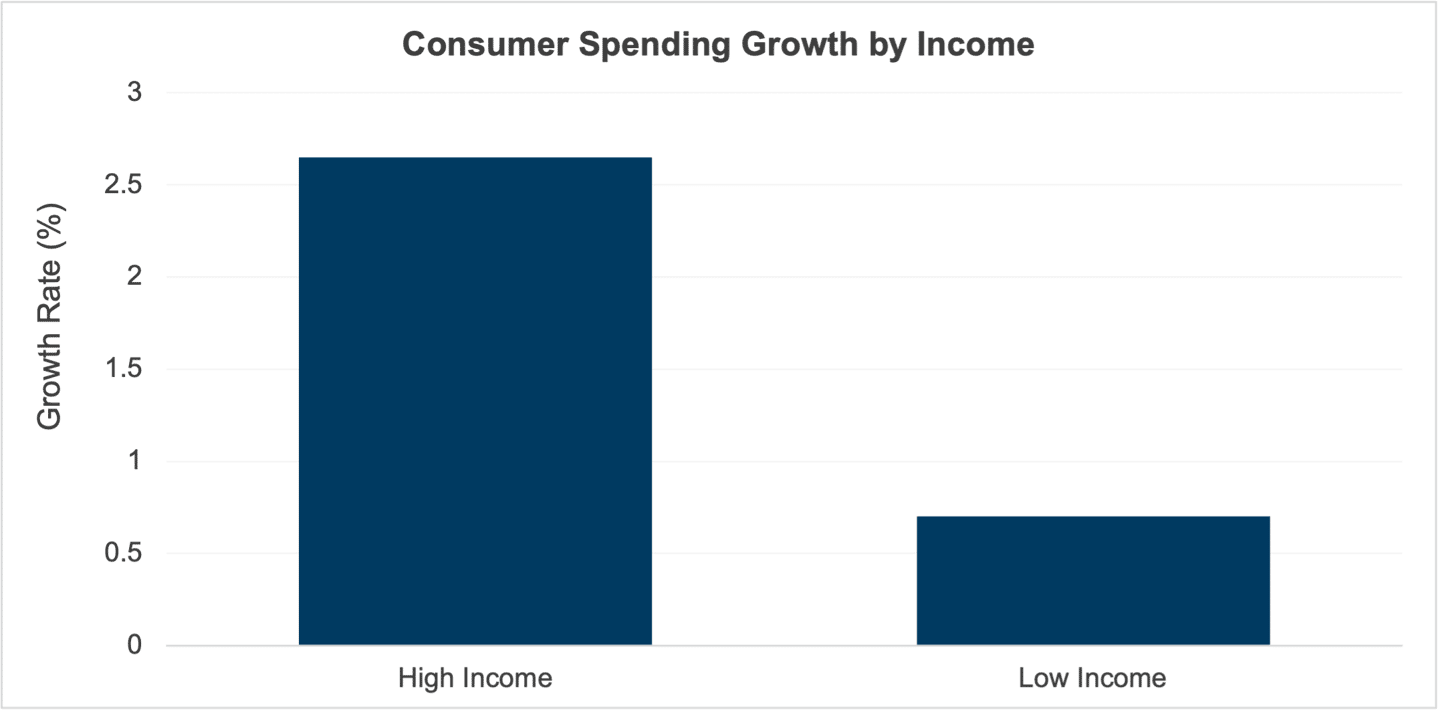
Differences in consumer behavior further illustrate this divide. Wealthier households have continued to increase discretionary spending on goods and services such as travel, luxury products and entertainment. Meanwhile, lower-income households are often constrained to spending primarily on necessities, with limited capacity for savings or investment. Thus, overall consumer spending may appear strong at first blush, but it is important to look beyond the headline numbers. In reality, robust consumer spending currently appears more concentrated among higher-income groups, masking underlying disparities.
The impact of a K-shaped economy on consumers can be substantial. High-income individuals are able to accumulate assets, expand their financial security and take advantage of economic opportunities. But a rising stock market does not lift all boats. Conversely, lower- and middle-income households face tighter budgets, increased financial stress and reduced mobility. These effects can lead to higher levels of debt and greater vulnerability to future economic downturns.
The implications for sustainable economic growth are equally significant. In the short term, strong spending by wealthier households can sustain aggregate demand and support overall growth. The data can even be encouraging. However, when economic activity depends heavily on a smaller segment of the population, it becomes less stable and more sensitive to changes in financial conditions. Additionally, because lower-income households typically spend a higher proportion of their income, stagnant earnings in this group can reduce overall demand and weaken the effectiveness of intended economic policy.
Long-term structural risks of K-shaped inequality
We acknowledge that over time, a persistent K-shaped dynamic can create structural challenges for the economy. For example, rising inequality may limit investments in education, workforce development and productivity-enhancing activities. It can also reduce labor force participation and slow long-term economic growth. These factors suggest that, while the economy may expand in aggregate terms, the benefits of growth are not evenly shared and may not be sustainable.
Ultimately, the K-shaped economy provides a valuable framework (and a clever visual reminder) for understanding the uneven nature of recent economic performance in the US. Although key indicators such as GDP and employment suggest overall strength, a deeper analysis is necessary, and currently it reveals significant disparities in outcomes across income groups. The persistence of these patterns underscores the importance of considering not only the scale of economic growth, but also how it is distributed across society. Moreover, any perpetuation of the K-shaped economy might have ramifications for policymakers at the Federal Reserve and the broader bond market. Thus, some investors might begin to wonder if it’s appropriate to extend duration, while others may consider tilting portfolios toward certain asset-backed or mortgage-backed securities. Whatever the case, our team is available to help you decipher the data, analyze the opportunities and make allocation decisions in line with your investment goals and risk tolerance.
Trading vista: New narrative, new opportunities
Jason Graveley, Senior Manager, Fixed Income Trading
For much of last year, the story in rates was fairly straightforward: yields drifted lower, the curve stayed inverted, and the market held on to a steady drumbeat of rate-cut expectations. The 2-year Treasury captured that move as well as anything, falling from roughly 4.38% in January 2025 to a low of 3.42% by October. It wasn’t always consistent, as there were plenty of ups and downs and even occasional bouts of volatility. But the general expectation was that rates were trending lower, and the data was supportive.
However, that narrative has shifted materially this year. So far in 2026, Treasury volatility has crept back into focus, and the front end has been at the center of the move. The same 2-year note that spent most of last year grinding lower has reversed course during the first half of the year, as markets have steadily backed away from the idea that rate cuts are just around the corner. The inverted curve, which defined much of the last cycle, has started to give way to a more normalized shape as yields reset higher.
So what’s been the key catalyst for this shift? At the very core, it’s been the data. Markets – and policymakers – continue to take a wait-and-see approach when it comes to rate cuts, but the inputs have become more challenging to ignore. Inflation has reaccelerated to its highest level in roughly three years, with a meaningful portion of that pressure coming from energy markets. Ongoing geopolitical tensions, particularly surrounding Iran, have kept oil prices volatile and elevated, feeding directly into headline inflation.
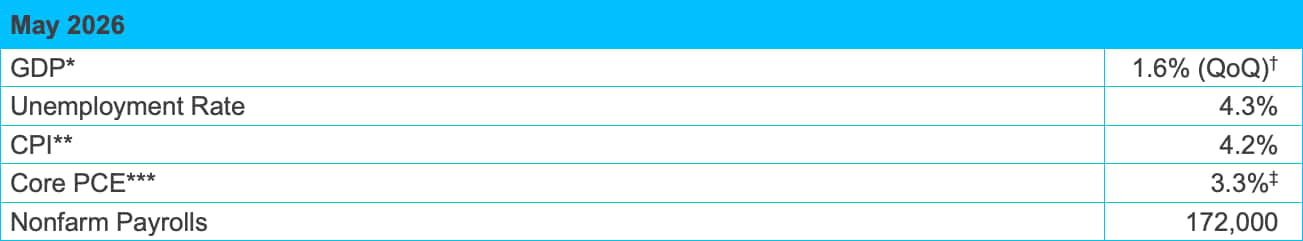
At the same time, the economy hasn’t shown many signs of deteriorating. The labor market in particular continues to come in stronger than expected. The most recent employment report (released in June) showed that the economy added 172,000 nonfarm payrolls, which was significantly higher than the consensus estimate. This reinforced the idea that growth remains resilient even in a higher-rate environment. That said, the employment strength hasn’t been uniform. Hiring trends have become increasingly fragmented – with healthcare continuing to drive job creation – while sectors like technology lag. This adds another layer of complexity to the economic and rate outlook.
A new storyline
Put it all together, and the market has had to rethink the path forward. The rate-cut narrative that dominated much of 2025 has faded into the background. It has been replaced with a growing acceptance that monetary policy may remain restrictive for longer than previously expected. Sticky inflation, combined with an uncertain geopolitical backdrop, has largely removed the rate-cut discussion. And in an elevated inflation regime, the bar for rate cuts is definitely higher. If we look at monetary policy expectations as of this writing, the curve has shifted to reflect rate hikes (not rate cuts!), with some expected as early as later this year. Things have really shifted, which will complicate the narrative for a Fed (and a new Fed chair) that was expected to be more dovish.
The silver lining
For fixed income investors, though, this shift hasn’t been without its benefits. Higher base rates have pushed all-in yields back into more attractive territory, even as credit spreads remain relatively contained. Investment grade corporates in the front end are now offering yields in the 4.0%-4.5% range, creating a more compelling opportunity to lock in income compared to where we’ve been over the last couple of years. That’s particularly notable when stacked against money market funds, which are currently yielding closer to the mid-3% range.
We’re also starting to see a bit more shape return to the curve. The front end has modestly steepened, and while the pickup isn’t dramatic in benchmarks, it does create some opportunities for investors. There’s roughly a 16-basis point (bps) difference between 1- and 2-year Treasuries at the time of writing (3.97% vs. 4.13%), offering the potential to capture incremental yield for any investor willing to extend slightly.1 Beyond that, moving out of pure money market fund exposure into short-duration credit introduces both additional spread and improved rolldown potential – something that’s been largely absent in recent years. For investors willing to take on a bit more credit risk, even a modest extension beyond typical liquidity constraints can add 30+ bps in yield, particularly in higher beta issuers.
So where do we go from here? As we’ve seen this year, the answer likely depends less on a single data point and more on the broader interplay among inflation, growth and geopolitics. If energy markets remain elevated and inflation stays sticky, the higher-for-longer narrative will remain intact. And as long as that’s the case, we should expect rates to stay elevated and volatility to remain part of the conversation. In the meantime, this environment continues to reward a more active approach. With higher yields, a steeper curve and anchored spreads, there’s more room to be selective and pick up incremental income without dramatically increasing risk.
Markets