- The Fed pivoted to a more accommodative policy stance with three rate cuts in 2025. Now investors are wondering if and when we’ll reach the neutral rate (i.e., r-star).
- The neutral rate is loosely defined as the interest rate that supports an economy’s full potential, with full employment and stable inflation.
- We expect the Fed to take a more gradual approach to future rate cuts; however, we believe it will cut rates more than one time this year before it reaches neutral.
Economic vista: Shifting to neutral
Travis Dugan, CFA, Managing Director, Portfolio Management
Road trips are great opportunities to explore, but in my family some members have more patience than others. At some point someone inevitably asks: “Are we there yet?” Ironically, this is the exact question that so many fixed income investors are pondering today.
As we begin a new year, we shift our focus to the journey of the US economy and the Federal Reserve’s targeted destination of the neutral rate. Will the Fed make a fourth consecutive rate cut when it meets in late January, or will it pause and await more economic data? And how will the rest of the year evolve? In this article we will explore the importance of the neutral rate (also known as r-star, or r*), why the Fed cares about it, and what we think it means for the future path of the fed funds rate.
The neutral rate
The neutral rate is loosely defined as the theoretical interest rate that supports an economy operating at its full potential, where the labor market is solid, and inflation is stable at the Fed’s 2% target. At neutral, monetary policy is neither considered restrictive nor accommodative. But threading the needle to balance the dual mandate and find “neutral” is not easy. If the Fed maintains rates that are too restrictive, it might cause a recession. Higher rates lead to higher borrowing costs, which impact rate-sensitive sectors, such as housing and autos. This can lead to a slowdown in growth, which in-turn could increase layoffs and push the unemployment rate higher.
On the other hand, if the Fed adjusts the policy rate too low, it might stoke inflation. Overly accommodative rates increase demand, which tends to push prices higher. If inflation remains elevated, as has been the case recently, the Fed risks losing credibility. This could lead to elevated inflation expectations, which sometimes have a tendency of being self-fulfilling. The Fed seeks to achieve a goldilocks economic scenario of not-too-hot and not-too-cold with the help of that elusive neutral rate.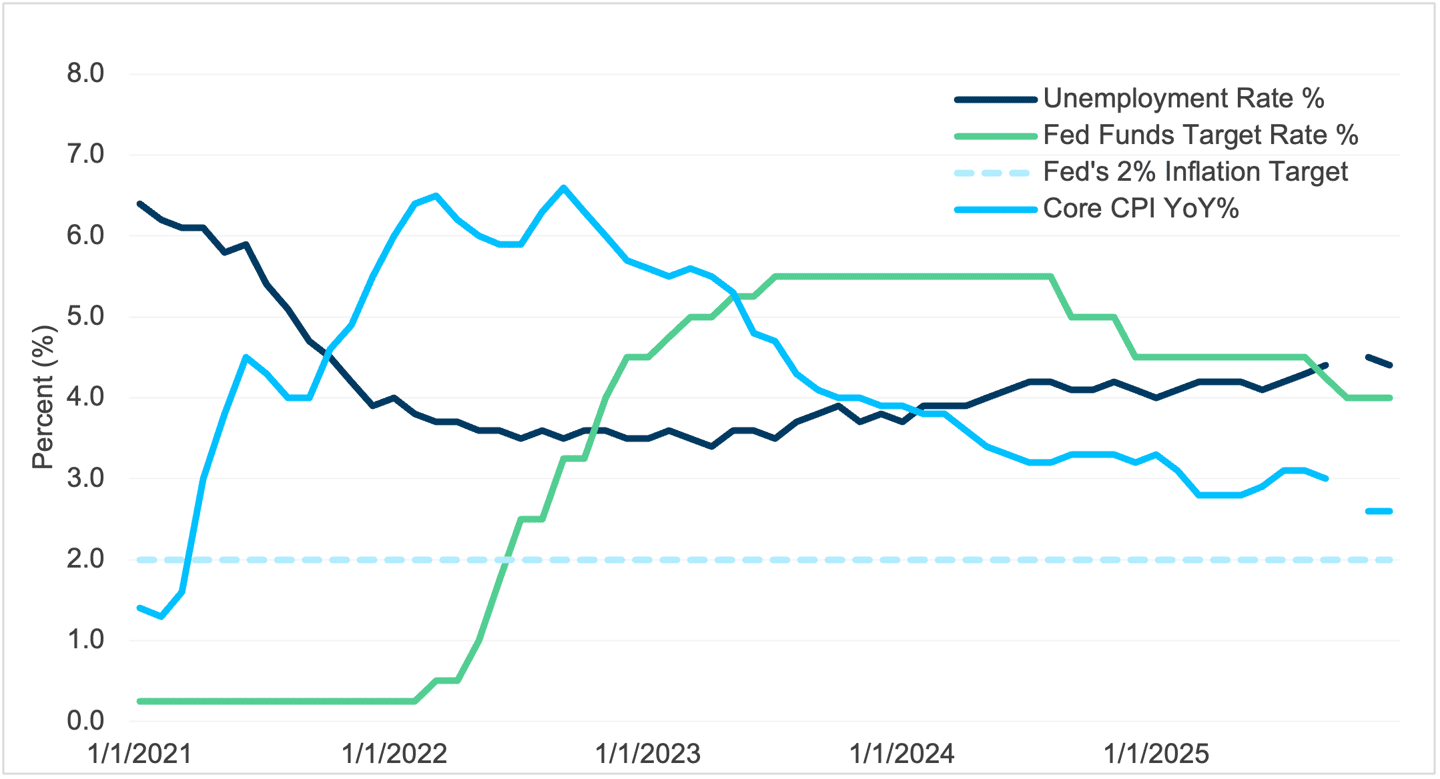
Source: Federal Reserve Bank and Bureau of Labor Statistics. Data as of 01/13/2026. *Gap in employment and Core CPI data is for October 2025 when no data was released due to the US government shutdown.
Unfortunately, there is no perfect way to calculate the neutral rate in real-time. It is unobservable in that it relies on concepts such as potential economic output and productivity growth. Technology is one factor that contributes to changes in economic output and productivity growth. In today’s world, artificial intelligence (AI) has everyone’s attention as it is expected to improve productivity over time. Another factor in calculating the neutral rate is the natural rate of unemployment. It is normal to have some level of unemployment in the economy. Frictional unemployment exists when people are between jobs. Structural employment exists when there is a mismatch between workers’ skills and/or locations where jobs are currently available. Demographics also impact unemployment due to effects on the participation rate. There are many factors that can impact the precise value of the neutral rate.
Because the neutral rate is fluid and must be estimated, several models have been created in an attempt to help. The inputs for these models vary, as do the outputs. Factors may include gross domestic product (GDP), trend growth (which evolves over time), inflation, long-run real yields, forward rates and term structure models. The Federal Reserve has many researchers who build and revise these models, each of which has its own strengths and weaknesses.
Every quarter the Fed produces and updates its Summary of Economic Projections (SEP), which are forecasts for key economic variables. The most recent projections were published at the December 2025 FOMC meeting and reflected expectations for unemployment to remain steady and for inflation to trend lower toward the Fed’s long-term target of 2%. Thus, the Fed forecasted only one rate cut of 25 basis points (bps) for 2026, which would indicate that the current fed funds rate is getting close to the neutral rate.
We believe, however, that the Fed’s forecast is a bit conservative. While it will likely take some time to reach the Fed’s 2.0% inflation target, we see inflation pressures subsiding this year. Also, the labor market remains solid but continues to show signs of softening, illustrated by lower nonfarm payroll prints and a recent uptick in the unemployment rate. Although we expect the Fed to take a more gradual approach to additional rate cuts, we believe it will cut rates more than once this year.
The following table shows the Federal Reserve board members and bank presidents’ SEP forecasts for upcoming years as they were predicted in December 2025 and September 2025.
Summary of Economic Projections (SEP) 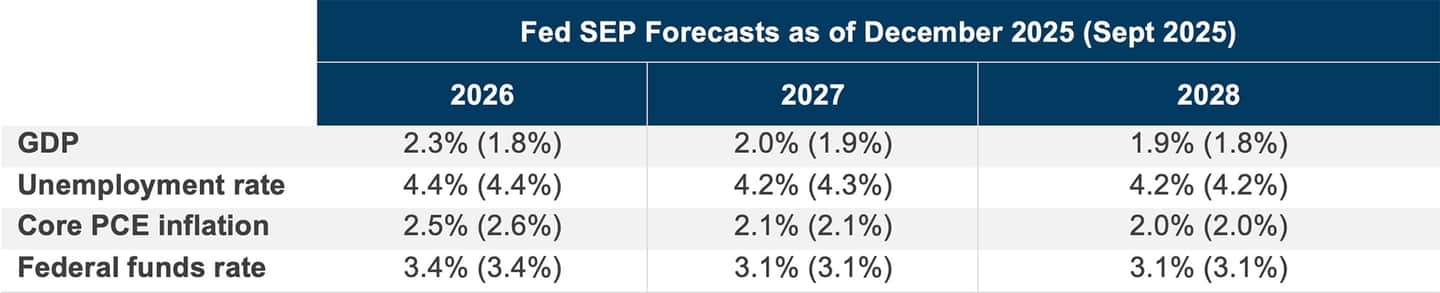
Source: SVB Asset Management, Federal Reserve Bank.
Are we there yet?
Unlike a road trip destination, the neutral rate can’t be calculated in real-time. This uncertainty reminds me of a recent road trip to the mountains where a snowstorm caused our navigation system to repeatedly add minutes (hours?!) to our estimated arrival time. Are we close to the neutral rate today, or do we have a long way to go? Ultimately, the answer may depend on the models used to make the forecasts (a little like a weather forecast). The timing may be unclear, but we do know that the Fed intends to get to neutral, and as additional economic data becomes available and their forecasts evolve, the Fed has the ability to hit the gas or the brakes. We’re watching the Fed closely for signals on its policy rate adjustments, and we aim to position portfolios appropriately during this journey to neutral.

Trading vista: New year, old story
Jason Graveley, Senior Manager, Fixed Income Trading
With a new calendar comes a fresh new take on markets – or so everyone hopes. But turning the page on the calendar year does little to wipe away much of what we saw through 2025. The same themes that were in place as we closed out 2025 are forecasted to persist into 2026. So how will all this shape expectations in the year ahead?
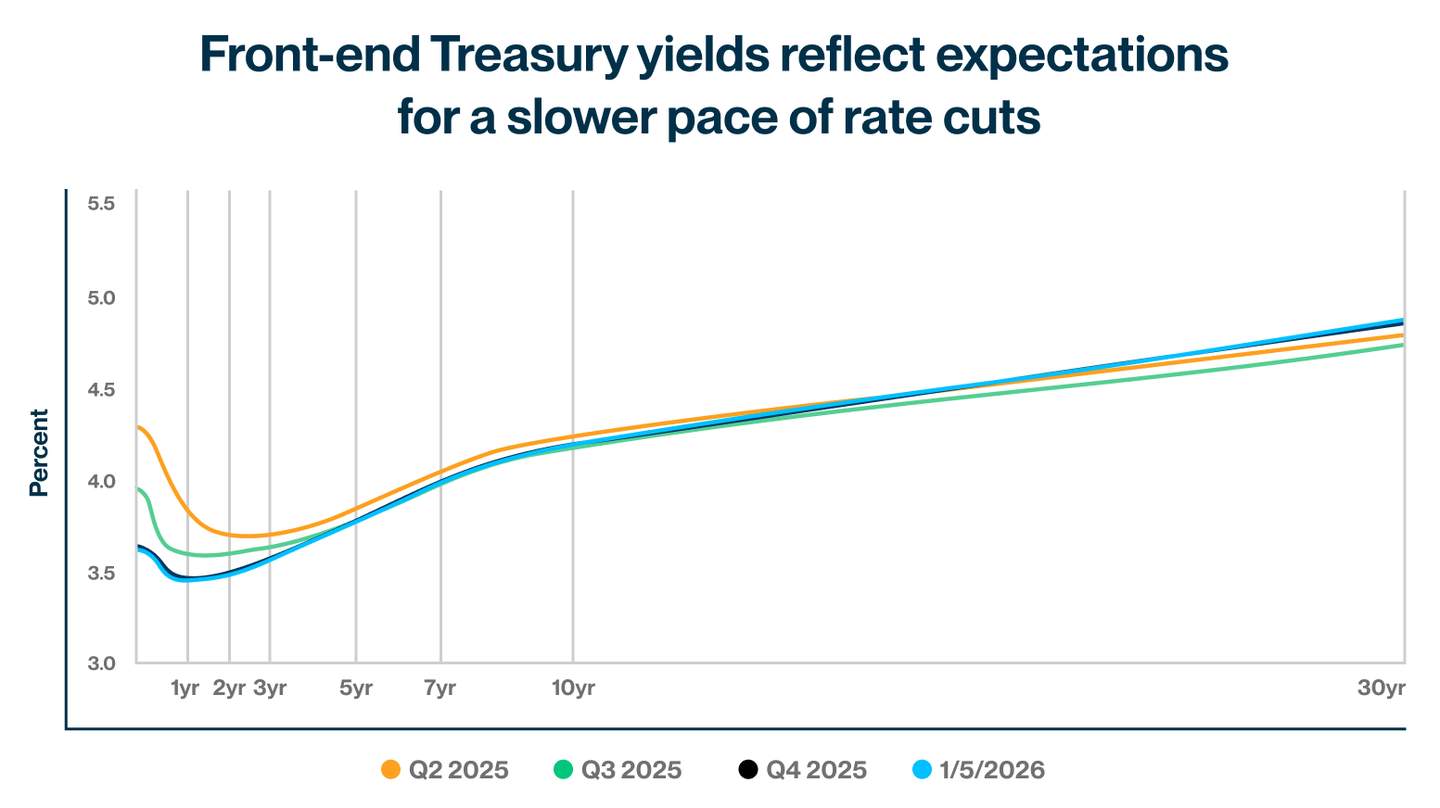
A good place to start is with the Federal Reserve and its evolving monetary policy. The current fed funds target rate is at a range of 3.50% to 3.75%, with the market forecasting two additional rate cuts through the end of 2026. This would bring it to a range of 3.00%-3.25%, where rates could remain in neutral for the foreseeable future. However, there appears to be less conviction around these future rate cuts (an approximate 60% probability) compared to the market’s near-certainty for the rate cuts of this past year. This is likely a result of a cautious Fed and the uncertain inflation outlook. Chairman Powell continues to emphasize that future rate cuts will be data dependent, as the committee looks to balance risks across its dual mandate. He also reiterated that the committee is well positioned to wait, which was a central theme through the summer of 2025 before the easing cycle began.
In addition, Chairman Powell’s appointment is set to end in May, and President Trump has repeatedly pushed for a more dovish monetary policy stance. Turnover within the Fed, questions regarding inflation and economic growth, and divergent views among some policymakers makes it challenging to forecast the trajectory of future cuts with confidence. In general, financial markets appear to be cautiously optimistic, hoping for more rate cuts but understanding that it’s far from a done deal. An emphasis on flexibility seems to be a fitting approach heading into the new year.
Solid demand to start
Despite the continued uncertainty surrounding monetary policy, credit markets are benefitting from strong technical factors and steady client demand. Benchmark rates are expected to remain rangebound, and there doesn’t appear to be a short-term catalyst significant enough to push credit spreads materially wider at this time. Even the recent, heightened geopolitical risks have done little to induce broader rate volatility. We have seen some projections suggesting that credit spreads will push slightly wider through the course of the year. However, most of this seems to be a response to how tight credit spreads are today on a historical basis, rather than concerns about potential systemic credit issues. There is only so much more tightening that can occur, so it makes sense to skew projections to the side with more room to run. Spreads may widen some from current levels but are expected to remain below long-run averages. In other words, investors may be more likely to emphasize selectivity and tactfully choose strategy and duration points of entry.
Given the current expectations for rangebound rates, tight spreads and continued strong client demand, we would also expect another robust year in terms of corporate issuance. The environment is very enticing for companies that wish to raise capital. After all, who can say no to cheap funding! The previous year finished with close to $1.6 trillion in total issuance, second only to the COVID-fueled and low-rate binge that occurred in 2020. We see 2026 continuing that trend, with forecasts for January new issuance ranging from $200 to $225 billion, which would make it the largest first month in history. Full year forecasts range as high as $1.8 trillion, which also would be a record. Refinancing needs, capital expenditure spending, and potential mergers and acquisitions should conspire to drive demand. In fact, there are over $1 trillion in investment grade bonds maturing this year alone, so client demand should keep pace with the increase in supply.
We may have turned the calendar page, but the overall market dynamics from late last year remain in place. Is it a new year with the same old story? We’ll be watching to see how it all unfolds.
Markets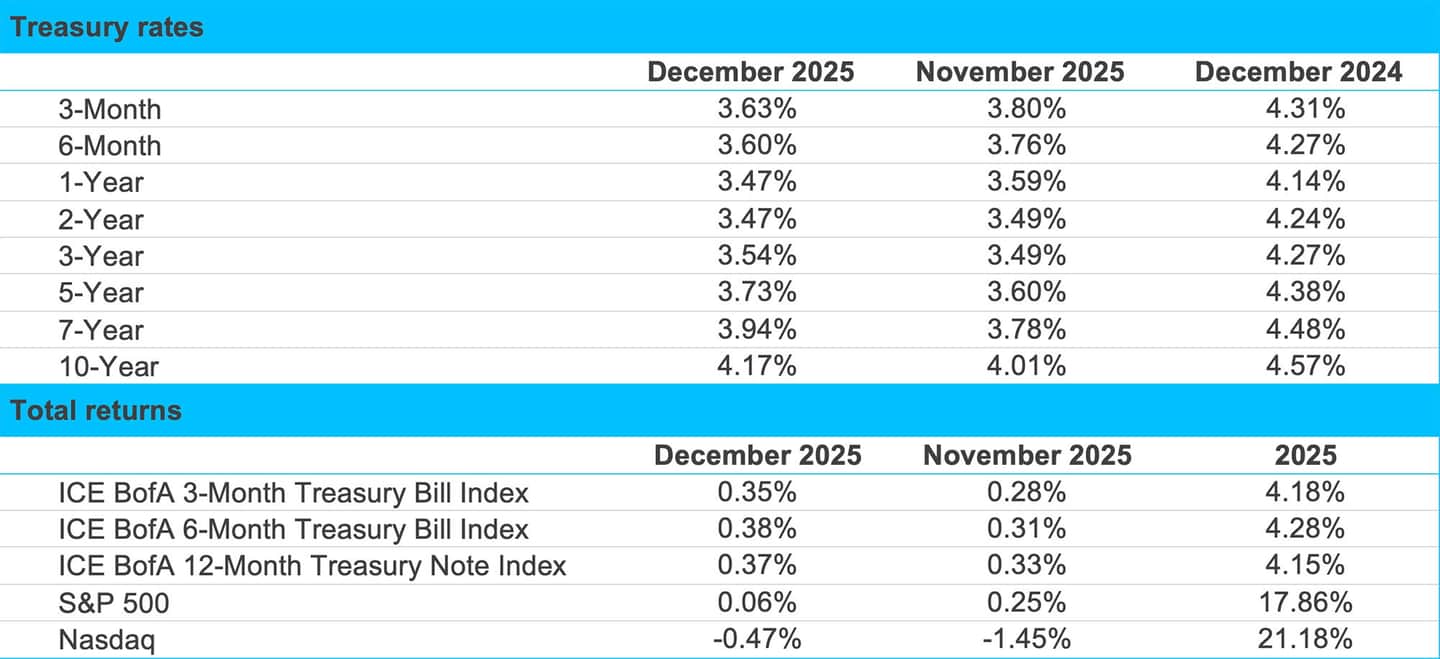
Source: Bloomberg and SVB Asset Management as of 12/31/2025.
Agency and corporate yields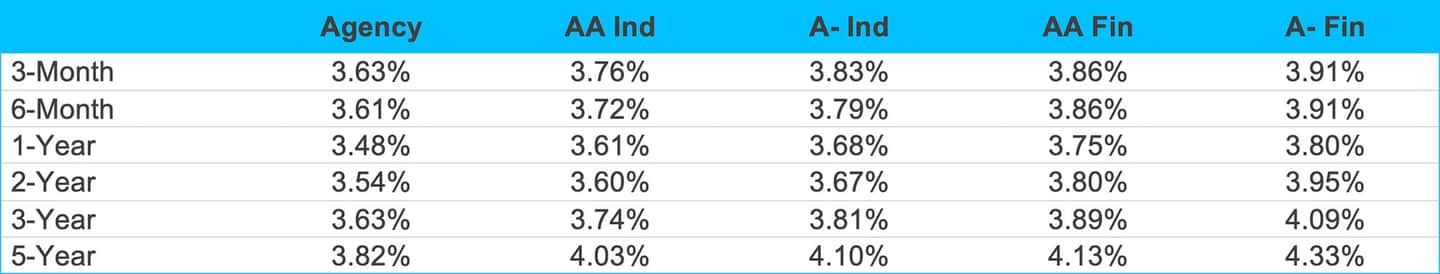
Source: Bloomberg, Tradeweb and SVB Asset Management as of 01/05/2026.
Source: Bloomberg, Tradeweb and SVB Asset Management as of 01/05/2026.
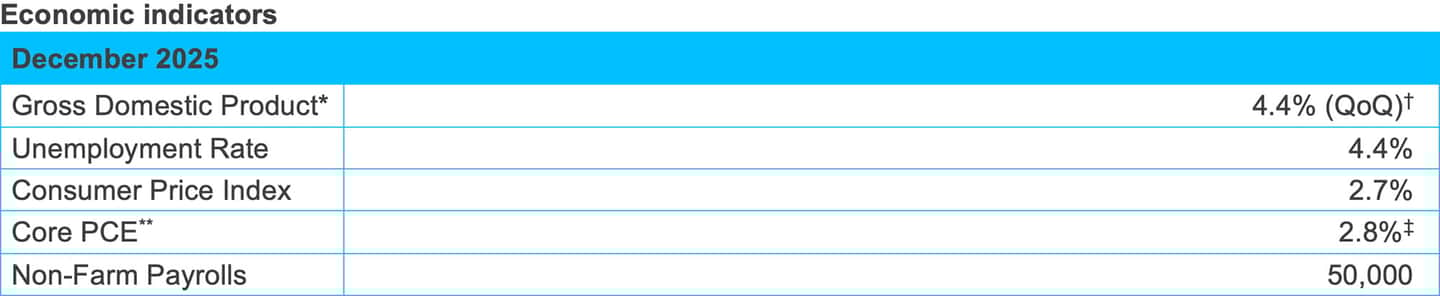
Source: Bloomberg, US Bureau of Economic Analysis (BEA) and US Bureau of Labor Statistics and Silicon Valley Bank as of 1/22/2026. *Current GDP release as of 1/22/2026. †QoQ — Quarter-over-Quarter. **Core Personal Consumption Expenditures. ‡Current PCE release as of 1/22/2026.