



- Front-end bond yields have risen meaningfully amid increased geopolitical uncertainty and a repricing of the US Treasury yield curve.
- Short-duration Treasury and investment-grade corporate bond yields are near the upper end of their historical ranges since 1999.
- Higher starting yields, a steeper yield curve and a greater cushion against adverse rate movements strengthen the case for revisiting short-duration fixed income allocations.
Economic vista: Front-end bond yields: Why short-duration fixed income looks attractive
Steve Johnson, CFA, Senior Portfolio Manager
Since the conflict with Iran began in February 2026, geopolitical uncertainty and changing monetary policy expectations have contributed to a meaningful repricing of the US Treasury curve. In this environment, front-end bond yields, including yields on short-duration US Treasuries and investment-grade corporate bonds, have moved higher. We believe the current fixed income outlook for 2026 has strengthened the case for short-duration fixed income. Front-end bonds now offer a compelling combination of attractive income, limited interest-rate risk and improved protection against adverse market movements.
Three developments have enhanced the appeal of the front end of the bond market: higher starting yields, a steeper yield curve and a larger income cushion against interest rate and credit spread volatility.
Front-end bond yields have increased meaningfully
The first and most obvious development has been the increase in available income for investors focusing on short-duration bonds. Since February 2026, yields on short-term Treasuries and investment-grade corporate bonds have moved substantially higher, creating significantly more attractive income opportunities. Although the repricing has contributed to periods of volatility, starting yields are now more attractive than they were at the onset of the conflict in the first quarter of 2026.
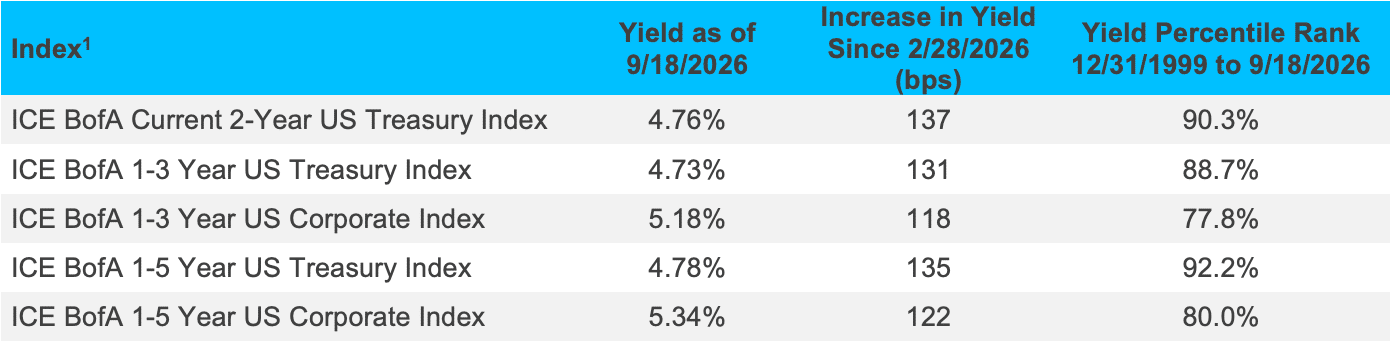
As of February 28, 2026, the ICE BofA Current 2-Year US Treasury Index yielded 3.39%. By September 18, 2026, that yield had risen to 4.76%, representing an increase of approximately 137 basis points (bps). Likewise, the ICE BofA 1-3 Year Treasury Index yield rose from 3.42% to 4.73% over the same period. Investment-grade corporates experienced similar upward moves, with the ICE BofA 1-3 Year Corporate Index yield increasing from 3.99% to 5.18%.
This increase is important because income remains the dominant driver of returns in short-duration fixed income portfolios. Investors can now earn yields near 4.5% to 5.0% while maintaining duration generally below two years. Historically, obtaining those levels of income often required taking significantly greater duration or credit risk.
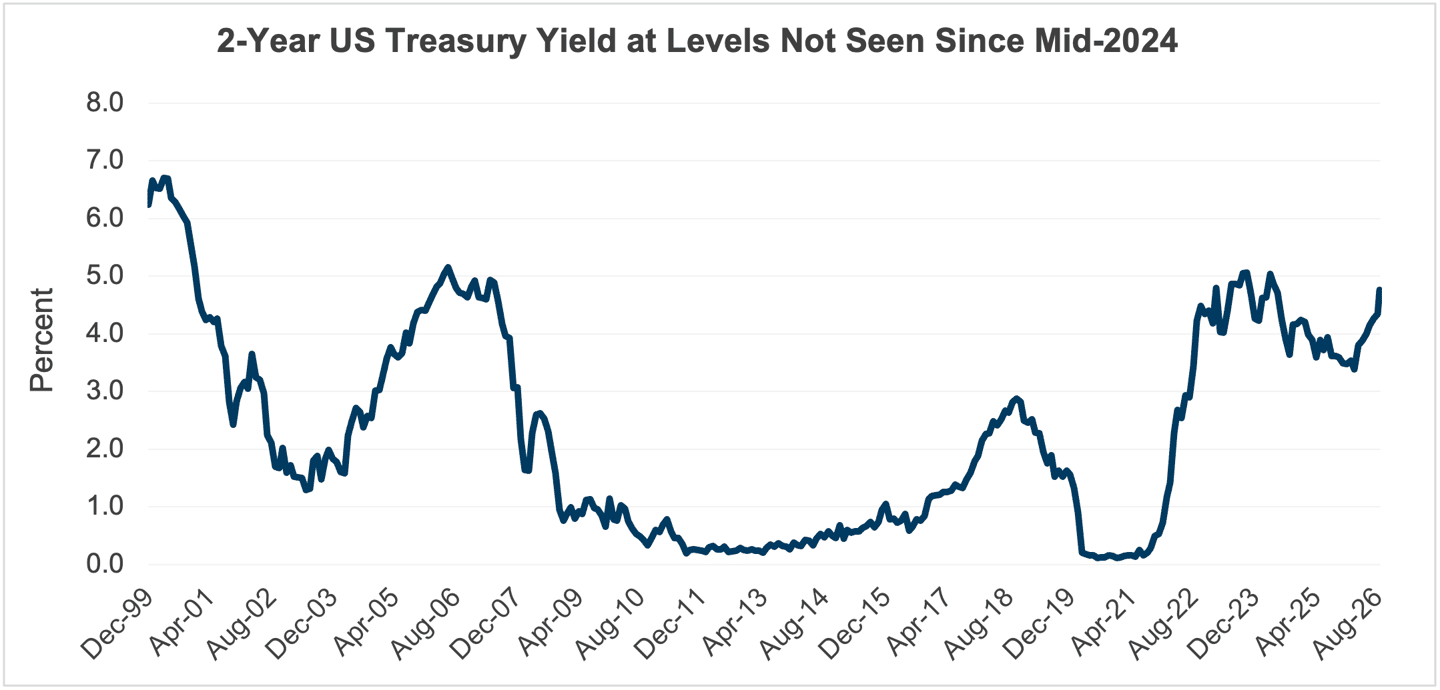
The elevated yield environment is also notable from a historical perspective. Current yield levels rank near the upper end of their historical distributions since 1999. The 2-Year Treasury Index sits at approximately the 90th percentile of monthly yield observations since 1999, while the 1-5 Year Treasury Index is near the 92nd percentile as well. Even short investment-grade corporate indices are near the 78th percentile of historical yield observations.2 These rankings indicate that investors have an opportunity to secure yields that have been available relatively infrequently over the past quarter-century. For investors who spent much of the post-global financial crisis era earning less than 1% in short-duration fixed income, today’s environment is markedly different. Today, investors can generate meaningful portfolio income without extending significantly out the yield curve. In many respects, the increased yield opportunity alone makes front-end investing substantially more attractive than it was before the conflict with Iran began.
Source: ICE Data Indices, LLC, Bloomberg and SVB Asset Management. Data as of September 18, 2026.
Yield curve steepening may encourage investors to move beyond cash
A second major development has been the steepening of the front end of the yield curve. Prior to the conflict, much of the Treasury curve remained deeply inverted as markets anticipated future easing by the Federal Reserve and a possible recession. Since February, however, the front end has repriced higher while the curve has moved toward a more normalized configuration.
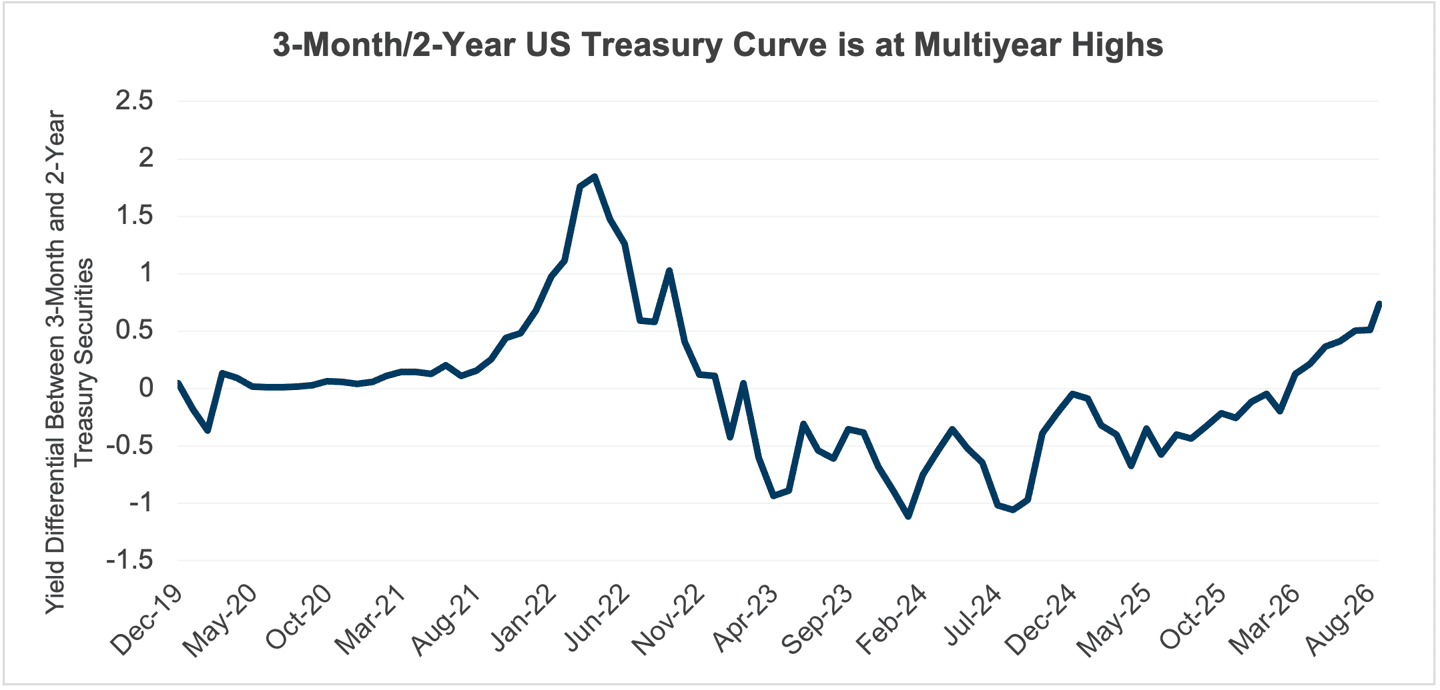
According to the data, the spread between 3-month Treasury bills (a reference point for short-term cash yields) and 2-year Treasuries increased from approximately negative 19 bps of inversion at the end of February 2026 to positive 73 bps as of September 18, 2026. This represents a steepening of roughly 92 bps over just six months.2
This steepening matters because it alters how investors are compensated for extending maturity. During periods of curve inversion, investors often receive little additional compensation for extending duration, so they are disinclined (or unmotivated) to shift out of money market funds. As the curve steepens, however, investors begin receiving more yield for moving modestly farther out on the curve while remaining within a relatively conservative duration profile.
Source: ICE Data Indices, LLC, Bloomberg and SVB Asset Management. Data as of September 18, 2026.
These yield levels provide attractive income while limiting duration exposure relative to intermediate- and long-term bonds. The result is a more balanced fixed income opportunity set. Investors are no longer forced to choose between extremely low yields in cash-like investments and greater duration risk farther out the curve for relatively little additional yield. Instead, the front end offers competitive income while maintaining a relatively conservative risk profile.
A steeper curve may also create more attractive reinvestment opportunities. Securities maturing over the near term can be reinvested at potentially attractive rates if elevated yields persist. This flexibility is particularly valuable in periods characterized by geopolitical uncertainty and shifting monetary policy expectations.
In short, the steepening curve has restored much of the traditional role of short-duration bonds as an attractive middle ground between cash and longer-duration fixed income.
Higher starting yields provide a larger cushion against rate volatility
The third and perhaps most underappreciated benefit of higher front-end yields is the increased protection against adverse market moves.
One of the strongest potential offsets against rising rates or wider credit spreads is simply earning more income. If bond prices decline as yields rise, today’s higher income provides a larger buffer before total returns turn negative. For most short-duration fixed income strategies, income typically contributes more to total return than price appreciation.
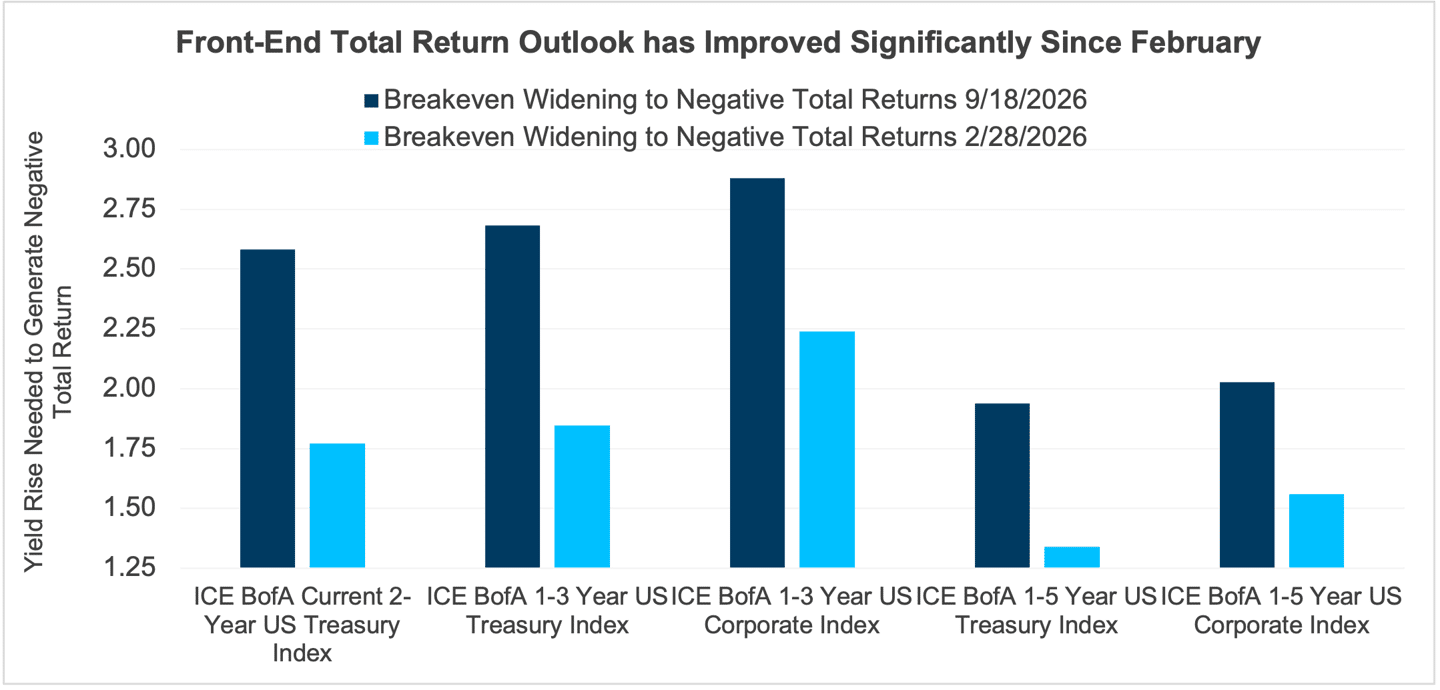
The data illustrates this point clearly. As of February 2026, the ICE BofA Current 2-Year Treasury Index could withstand approximately 177 bps of adverse yield increase before experiencing a negative total return over a one-year horizon. By September 2026, that protection had increased to approximately 258 bps.
Source: ICE Data Indices, LLC, Bloomberg and SVB Asset Management. Data from February 28, 2026 to September 18, 2026.
These figures demonstrate that investors now have substantially larger margins of safety than they did at the beginning of the conflict with Iran earlier this year. This matters because geopolitical events often increase market volatility and create abrupt shifts in interest rate expectations. In lower-yield environments, relatively modest increases in yields can rapidly erase income and push total returns negative. Today's higher starting yields reduce that vulnerability considerably.
In other words, investors are now being paid substantially more to assume the same amount of duration risk they faced earlier in the year. The result is an improved risk-reward tradeoff that makes front-end fixed income comparatively attractive in an environment where geopolitical outcomes remain uncertain.
Reassessing short-duration fixed income
Since the conflict with Iran began in late February 2026, the opportunity in front-end bonds has improved. Higher absolute yields, a steeper curve and a larger income cushion against adverse interest-rate and price movements have strengthened the risk-reward profile of short-duration fixed income. For investors seeking a combination of income, capital preservation and flexibility, front-end bonds may offer a more compelling opportunity than they did before the conflict began. Contact SVB Asset Management to discuss short-duration fixed income positioning for your portfolio.
Credit vista: Playing the right cards? Evaluating fintech credit card ABS
Timothy Lee, CFA, Senior Credit Analyst
There’s a new player in the credit card ABS (asset-backed securities) market, and its name is Fintech. Is this the emergence of a burgeoning opportunity set for fixed income investors? Or is it another bad hand tantamount to drawing the bottom of the barrel? Let’s take a look at credit card ABS and consider if the emerging fintech players are in a position to disrupt the ABS card market and in turn offer investors intriguing yield potential.
Historically, ABS collateralized by US credit card receivables have been issued only by traditional banks to help finance their own card programs. Fintechs, financial technology companies that are not traditional banks, are now competing against traditional bank credit cards through technology-driven platforms and products, often appealing to customers looking to improve their credit scores. As adoption grows, fintech sponsors are increasingly following in the footsteps of traditional banks by turning to the ABS market to fund their growth. Should investors play along?
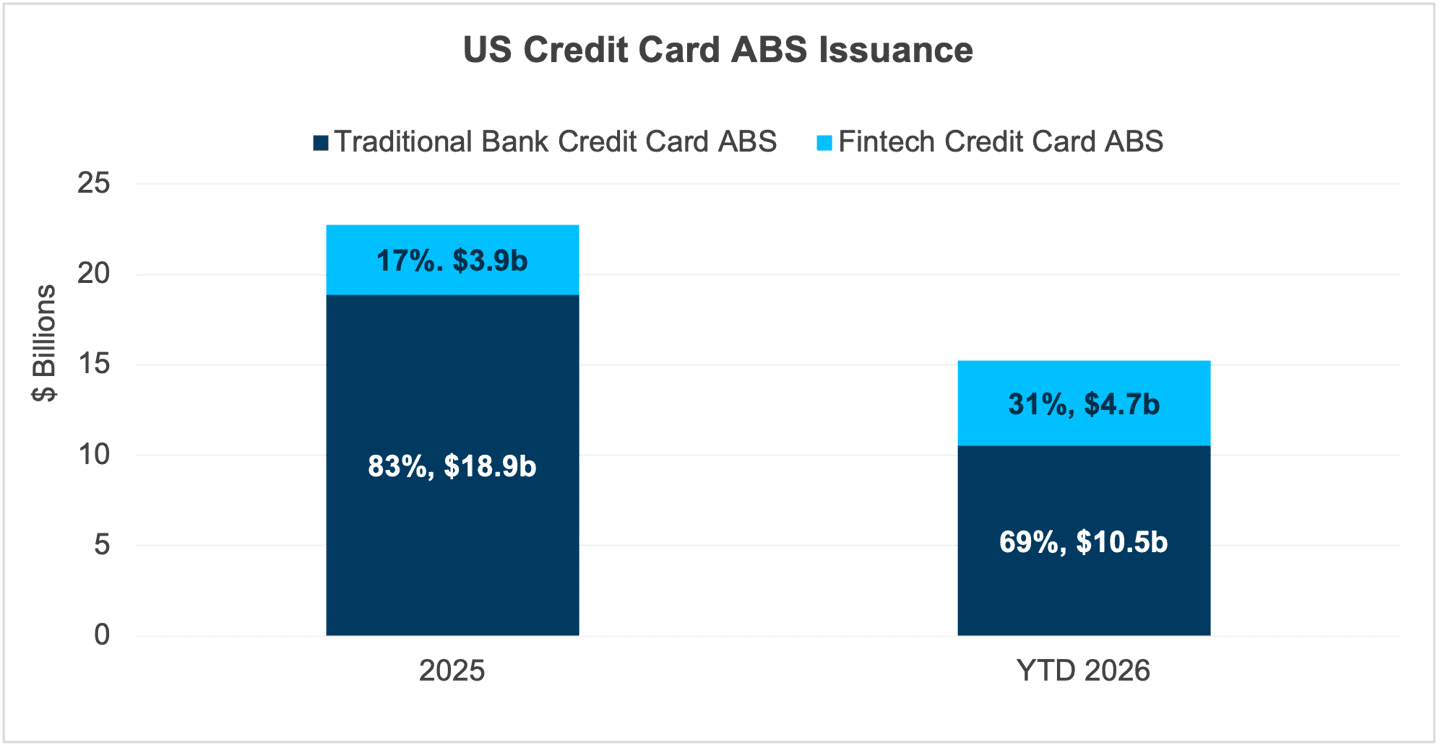
Fintech-sponsored US credit card ABS issuance through September 14, 2026, was approximately 21% higher than total 2025 issuance. Although fintech issuance remains smaller than issuance from traditional banks, its share of the market has increased meaningfully.
Source: Bloomberg. Data as of September 14, 2026. Issuance data are estimates and include transactions not closed as of September 14, 2026. Issuance data include US dollar ABS transactions collateralized by US credit card accounts. Excludes US dollar ABS transactions containing Canadian and other non-US credit card accounts.
A growing footprint
Fintechs are increasing their market share in ABS issuance backed by US credit card receivables, comprising 31% of the total amount issued in 2026, up from 17% in 2025. Fifteen different ABS trusts have issued in 2026, with eight of them from fintech sponsors; in the previous year, only six of the 15 total issuers were fintech sponsored issuers.
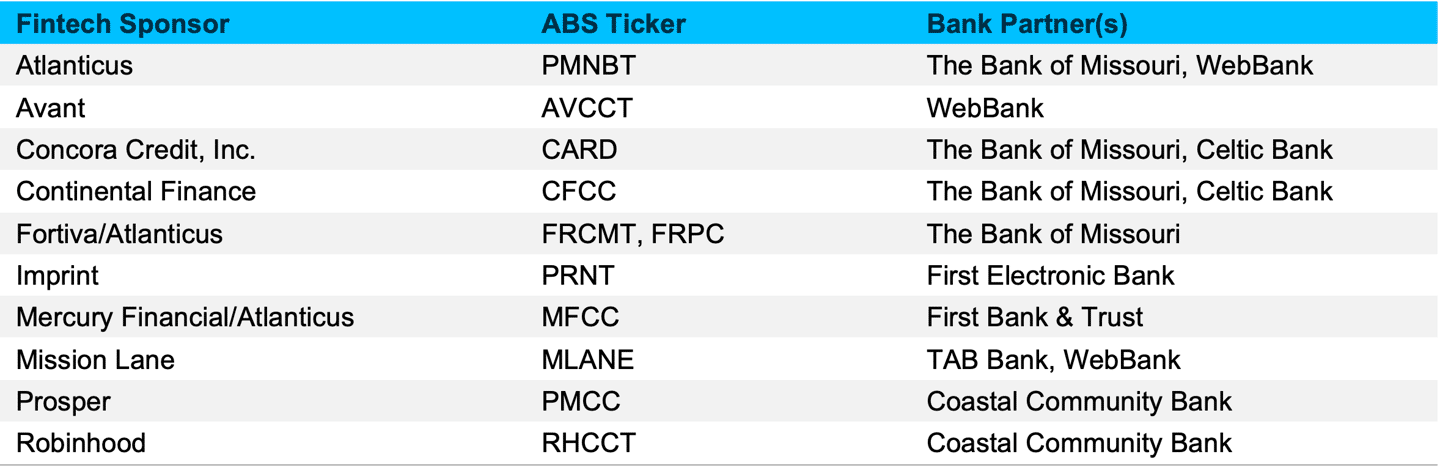
Fintechs utilize FDIC insured banks to originate their credit cards.
Sources: Bloomberg, SVB Asset Management. Data as of September 11, 2026.
Since most fintechs aren’t banks, they partner with actual banks to issue their credit cards. Coastal Community Bank, The Bank of Missouri, and First Electronic Bank are among the frequent federally insured and regulated banks that fintechs partner with. This model can offer complementary capabilities: regulated banks are the originators and owners of the credit card accounts, while the fintechs leverage technology and innovative platforms to provide the development, marketing and servicing of the credit card program. Fintechs issue ABS to fund the purchase of credit card receivables generated through their programs and sold by the partner bank. The partner bank continues to be the credit card account owner and generate credit card receivables to sell to the fintech sponsored ABS card trust. Fintechs typically remain the servicer of the receivables in the ABS transaction.
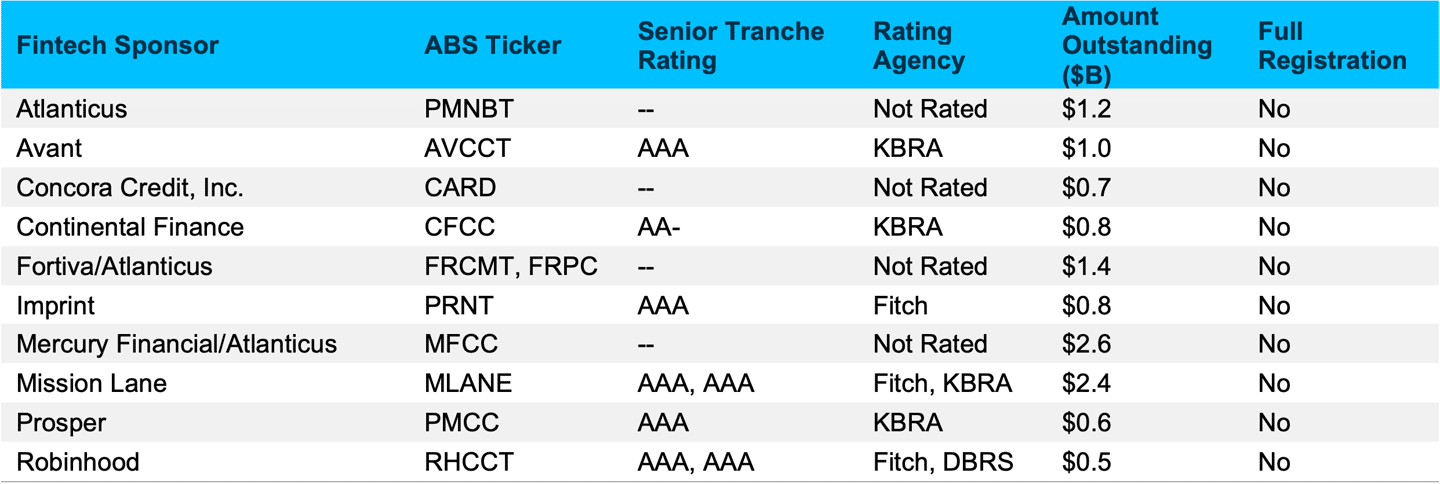
Fintech sponsored ABS transactions have generally been privately placed, relatively small and may not carry an agency rating.
Source: Bloomberg, Fitch, KBRA, DBRS. Data as of September 11, 2026.
Fintech card ABS have not received as much investor attention as traditional bank card ABS due to their small relative size. Approximately $12 billion was outstanding across 10 fintech-sponsored ABS issuers, averaging $1.2 billion per issuer. By comparison, traditional bank credit card ABS had approximately $54 billion outstanding across 10 issuers, averaging $5.4 billion per issuer, or about 4.5 times the fintech average. Visibility for fintech card ABS has also been limited by the private placement nature of their issuance and a lack of agency ratings, with some programs carrying no ratings and many others with only one rating (typically from Fitch or alternative agencies such as KBRA or DBRS). Most rated senior tranches carry AAA ratings.
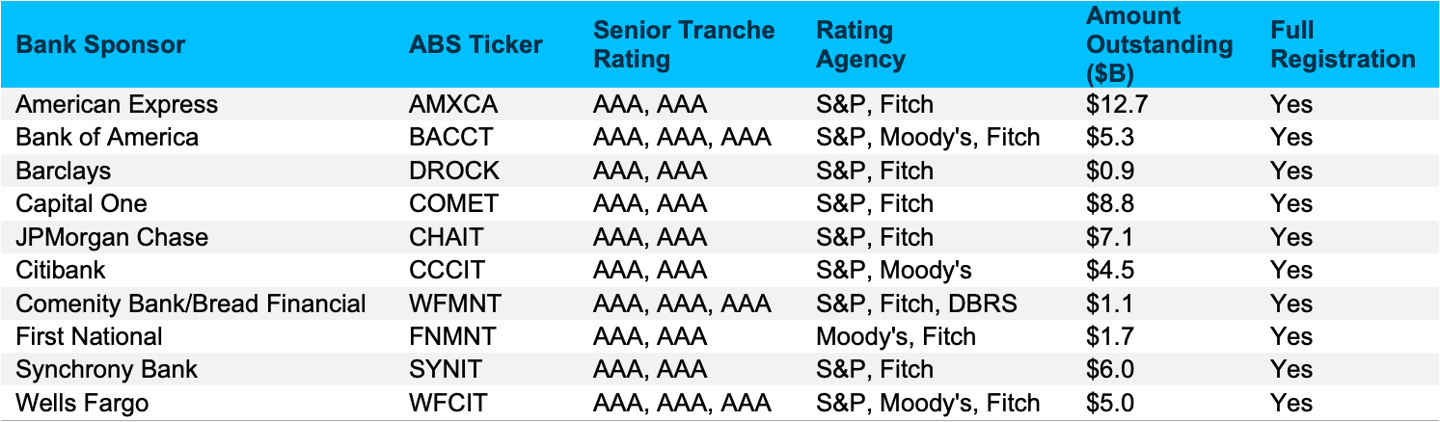
Traditional bank credit card ABS programs are generally fully registered programs with significant amounts outstanding and carry at least two agency ratings.
Source: Bloomberg, S&P, Moody’s, Fitch, DBRS. Data as of September 11, 2026.
Comparatively, traditional bank card ABS programs tend to receive ratings from established raters S&P and Moody’s, as well as Fitch, with senior tranches also carrying the highest AAA rating. Traditional bank card ABS are all fully registered public transactions, which helps elevate its prominence among investors.
Charge-off rates have been well below expectations for credit card ABS issued by both fintechs and traditional banks.
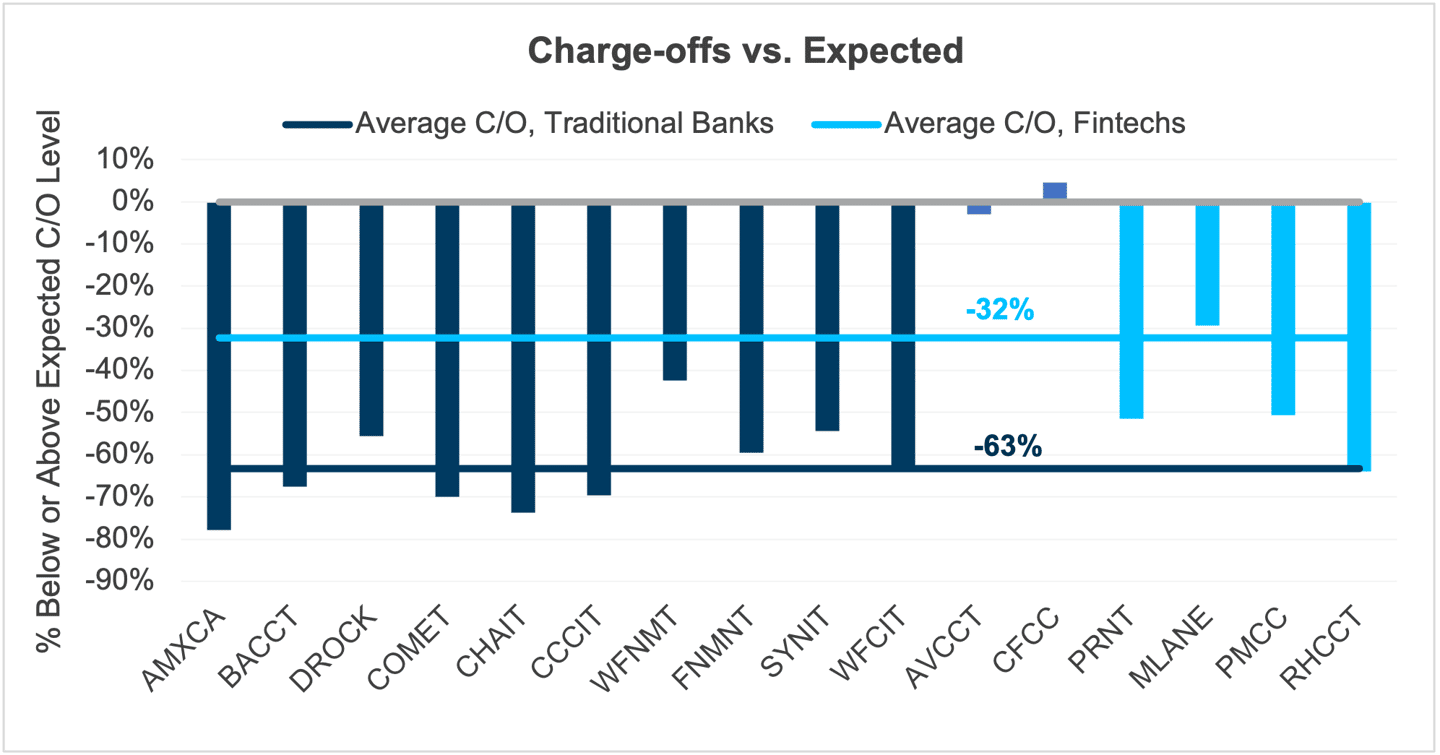
Source: Bloomberg, BofA Securities, J.P. Morgan Securities LLC, Fitch Ratings, KBRA, S&P Ratings, Offering Memorandums. Data is for July 2026. Expected means the base-case charge-off rate assigned to each trust by Fitch or KBRA, in the case where a Fitch rating is unavailable. RHCCT data is for five months ending May 2026. PRNT data is for May 2026. PMCC data is for sponsor’s managed pool for six months ending June 2026. Average C/O, Traditional Banks: The average charge-off rate of AMXCA, BACCT, DROCK, CHAIT, CCCIT, WFNMT, FNMNT, SYNIT, and WFCIT. Average C/O, Fintechs: The average charge-off rate of AVCCT, CFCC, PRNT, MLANE, PMCC, and RHCCT. Some fintech ABS were excluded due to not being agency rated.
Comparing fintech and bank credit card ABS performance
Despite differences in size and registration status, both fintech and traditional bank card ABS have exhibited healthy recent credit performance.
Charge-offs in card ABS have been well below expectations, with the average charge-off rate for ABS card trusts from traditional banks 63% below the base-case assumption. Low charge-off rates have been supported by seasoned accounts in the ABS trusts of traditional banks, with some trusts containing accounts with average ages over 15 years. Fintechs, in contrast, have relatively newer accounts, with the average account age of less than two years for some trusts. Nonetheless, the average charge-off rate for fintech card ABS was 32% below expectations.
Charge-offs have decreased for most ABS trusts.
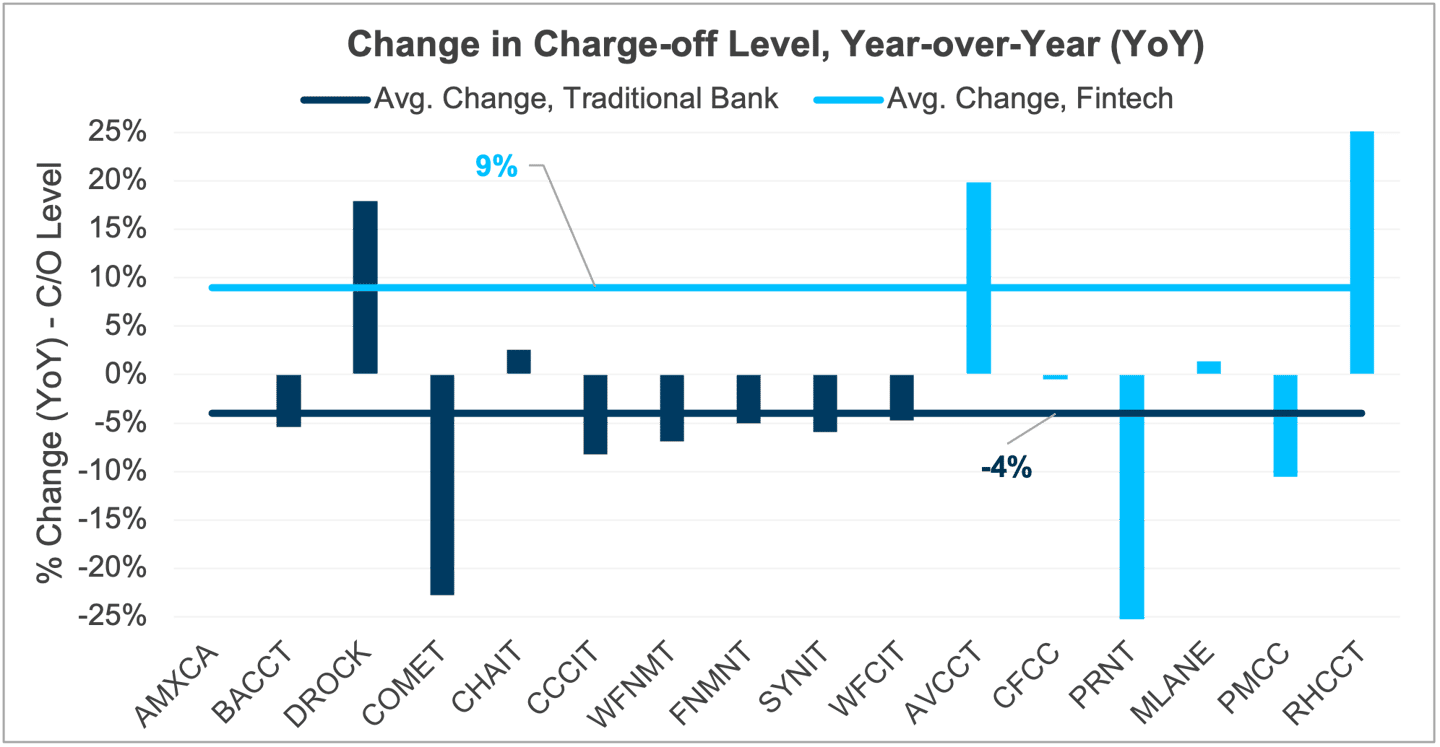
Source: Bloomberg, BofA Securities, J.P. Morgan Securities LLC, Fitch Ratings, KBRA, S&P Ratings, Offering Memorandums. Data is for July 2026 and July 2025. Change is calculated as the percentage increase or decrease from 2025 charge-off level to 2026 charge-off level. RHCCT data is for the five months ending May 2026 and the six months ending June 2025. PRNT data is for May 2026 and May 2025. PMCC data is for the six months ending June 2026 and the year ending December 31, 2025.
Charge-off rates for fintech card ABS were 9% higher on average than last year, though the average was skewed by an increase in new accounts in Robinhood’s trust portfolio that pushed the charge-off rate up from low levels. Overall, fintech card ABS charge-off rates remain well within expected loss levels and appear poised to improve over time as accounts age. Of course, performance will remain sensitive to consumer credit conditions and the economic environment. In traditional bank card trusts, seasoned accounts helped charge-off rates fall an average of 4% compared to the prior year.
Monthly payment rates are very high in traditional bank card trusts but lower in fintech card trusts.
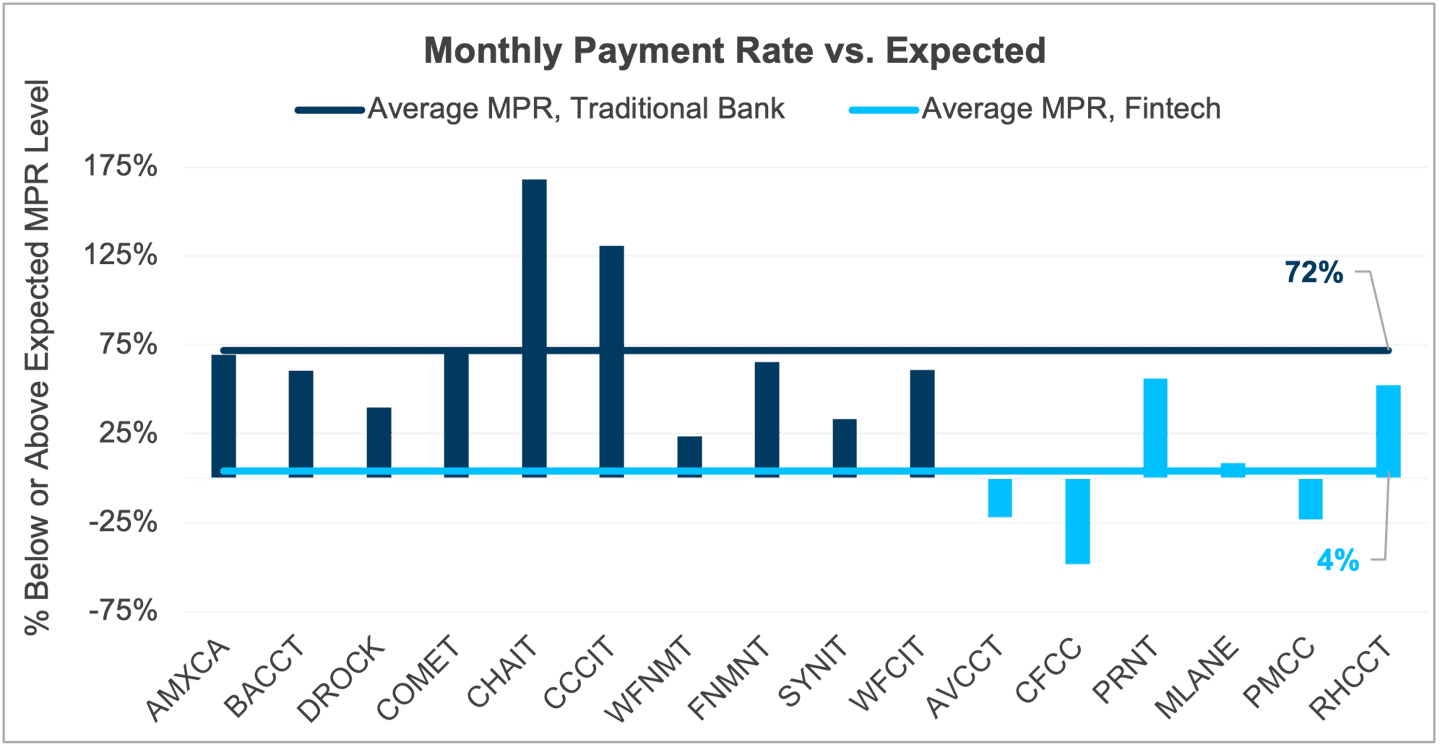
Source: Bloomberg, BofA Securities, J.P. Morgan Securities LLC, Fitch Ratings, KBRA, S&P Ratings, Offering Memorandums. Data is for July 2026. Expected means the base-case monthly payment rate (MPR) assigned to each trust by Fitch or KBRA, in the case where a Fitch rating is unavailable. RHCCT data is for five months ending May 2026. PRNT data is for May 2026. PMCC data is for the sponsor’s managed pool, six months ending June 2026. Average MPR, Traditional Bank: The average MPR of AMXCA, BACCT, DROCK, CHAIT, CCCIT, WFNMT, FNMNT, SYNIT, and WFCIT. Average MPR, Fintech: The average MPR of AVCCT, CFCC, PRNT, MLANE, PMCC, and RHCCT. Some fintech ABS were excluded due to not being agency rated.
Low charge-off rates in traditional bank card trusts were also aided by high monthly payment rates, which were averaging 72% above the base case rate. Monthly payment rates for fintech card trusts were mixed, with three trusts experiencing lower than expected payment rates while three trusts are experiencing higher than expected payment rates.
Monthly payment rates have held steady from prior year levels, with moderate increases across many traditional bank and fintech trusts.
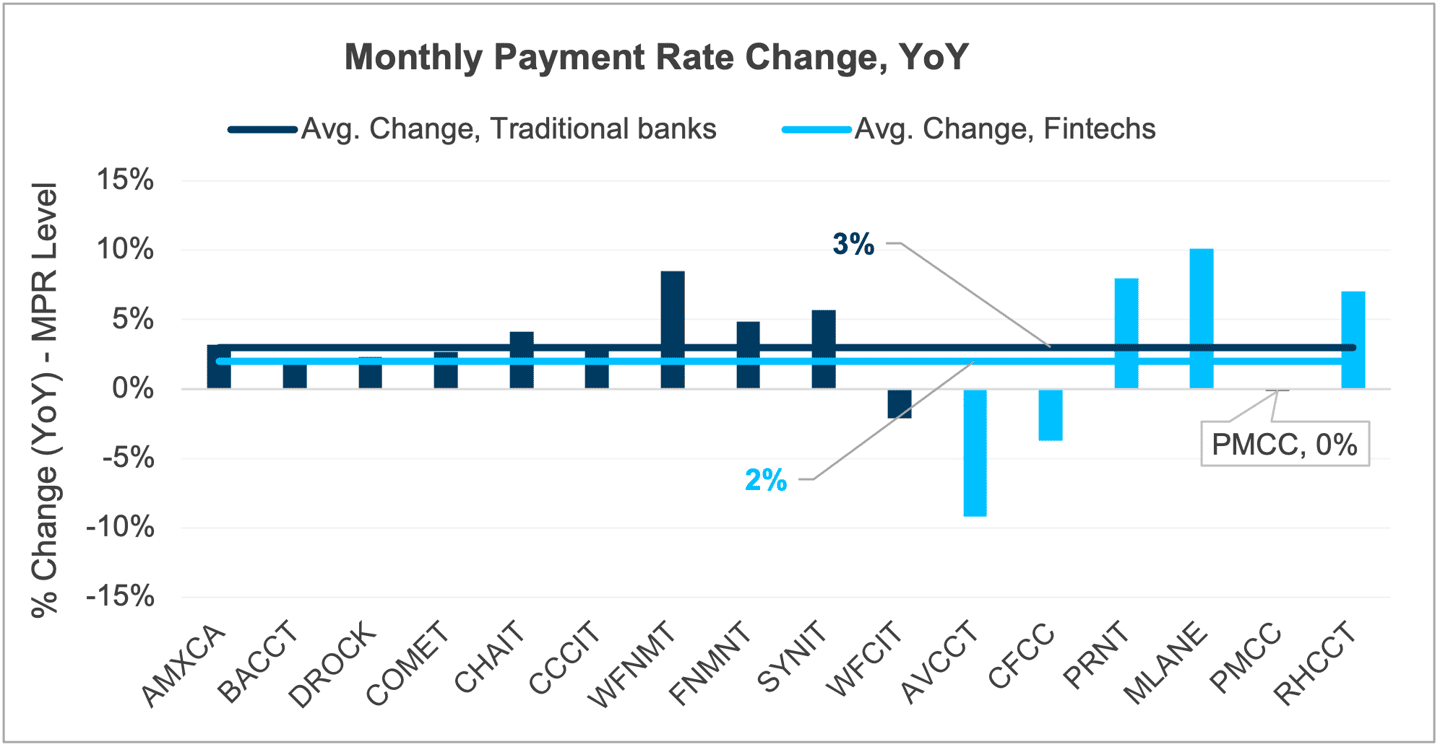
Source: Bloomberg, BofA Securities, J.P. Morgan Securities LLC, Fitch Ratings, KBRA, S&P Ratings, Offering Memorandums. Data is for July 2026 and July 2025. Change is calculated as the percentage increase or decrease from 2025 MPR level to 2026 MPR level. RHCCT data is for the five months ending May 2026 and the six months ending June 2025. PRNT data is for May 2026 and May 2025. PMCC data is for the six months ending June 2026 and the year ending December 31, 2025.
Monthly payment rates for fintech card trusts increased by an average of 2% from the prior year period, with higher payment rates in three trusts. In part, this reflects improving credit positioning of underlying account holders. Two fintech trusts experienced lower monthly payment rates than last year, indicating increased demand to carry balances. For all fintech card trusts, payment rates remain comfortably above expected levels and their performance nearly matches that of traditional bank card trusts, which experienced a 3% higher monthly payment rate.
Fintech and traditional bank credit card ABS trusts have generated yields above base-case expectations.
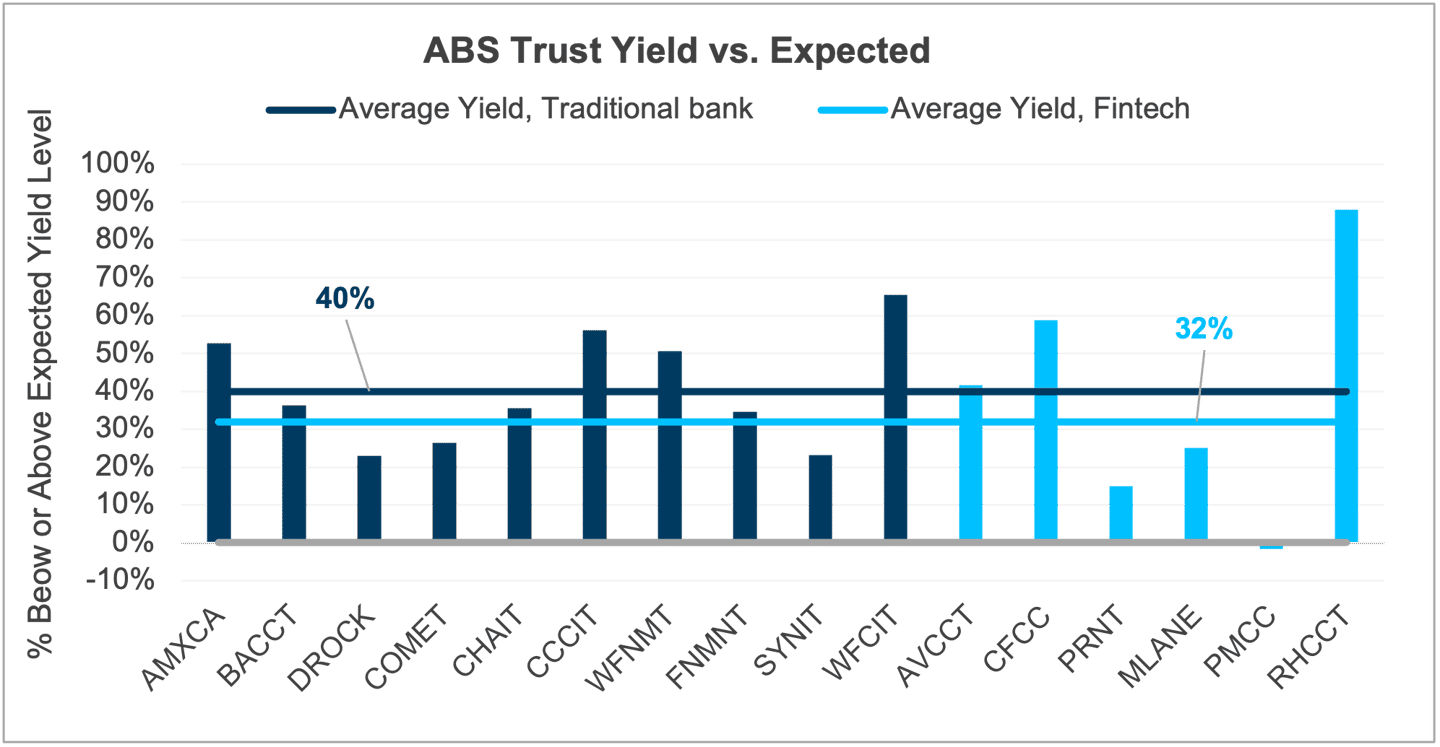
Source: Bloomberg, BofA Securities, J.P. Morgan Securities LLC, Fitch Ratings, KBRA, S&P Ratings, Offering Memorandums. Data is for July 2026. Expected means the base-case yield level assigned to each trust by Fitch or KBRA, in the case where a Fitch rating is unavailable. RHCCT data is for five months ending May 2026. PRNT data is for May 2026. PMCC data is for the sponsor’s managed pool, six months ending June 2026. Average Yield, Traditional Bank: The average trust yield of AMXCA, BACCT, DROCK, CHAIT, CCCIT, WFNMT, FNMNT, SYNIT, and WFCIT. Average Yield, Fintech: The average trust yield of AVCCT, CFCC, PRNT, MLANE, PMCC, and RHCCT. Some fintech ABS were excluded due to not being agency rated.
Yield performance in fintech card trusts is also keeping pace with that of traditional bank trusts, with yields averaging 32% higher than expected versus an average of 40% higher in traditional bank card trusts, which generally generate strong yields from interchange fees. For fintech card trusts, finance charges and fees are strong yield generators, making them more sensitive to interest rate changes, while regulatory changes to interchange fees would more likely impact traditional bank card trusts.
Yields are broadly stable across fintech and traditional bank card ABS trusts.
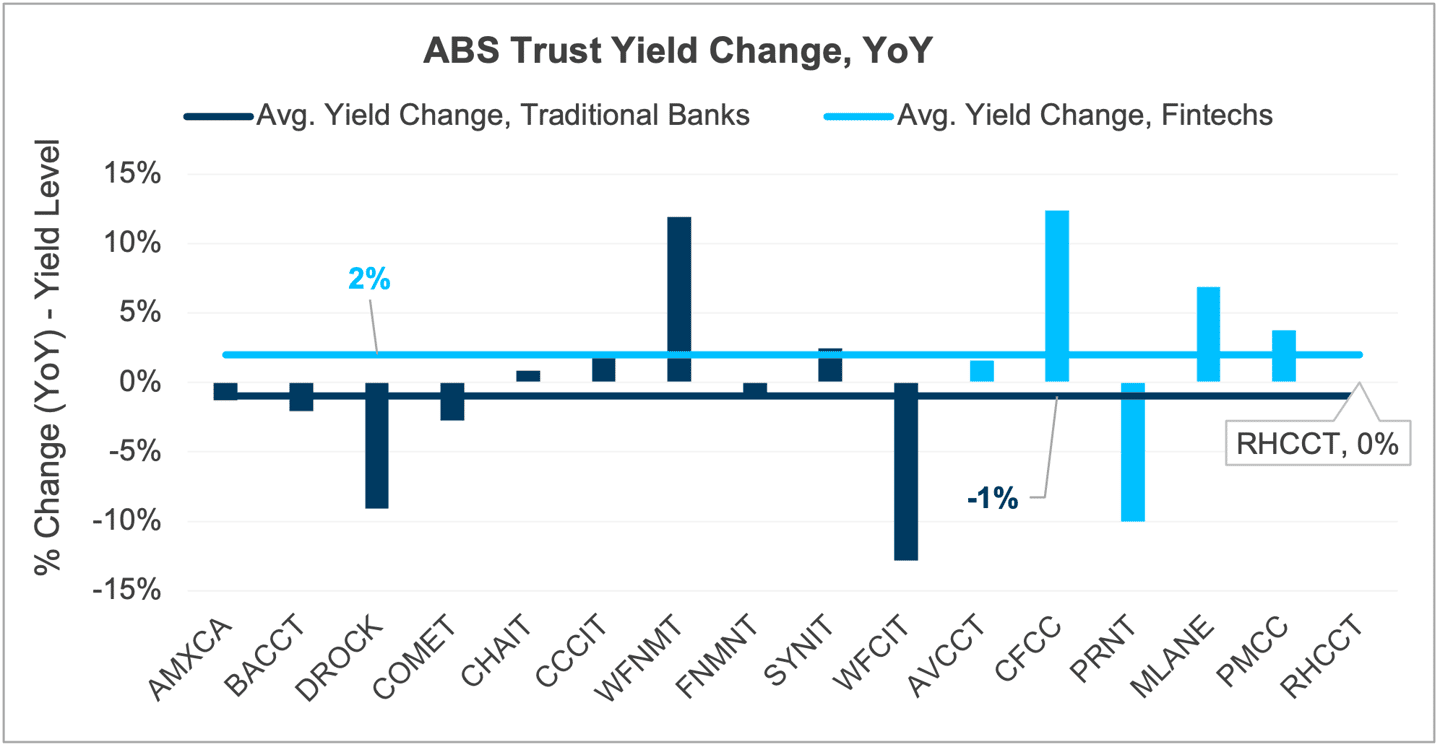
Source: Bloomberg, BofA Securities, J.P. Morgan Securities LLC, Fitch Ratings, KBRA, S&P Ratings, Offering Memorandums. Data is for July 2026 and July 2025. Change is calculated as the percentage increase or decrease from 2025 yield level to 2026 yield level. RHCCT data is for the five months ending May 2026 and the six months ending June 2025. PRNT data is for May 2026 and May 2025. PMCC data is for the six months ending June 2026 and the year ending December 31, 2025.
Yields were 2% higher on average versus last year in fintech card trusts while yields were down 1% on average for traditional bank card trusts. Both types of card trusts are generating steady yield levels that are leading to positive excess spread that provides an additional layer of credit protection for ABS investors.
Delinquencies are broadly lower for traditional bank card trusts while trends were mixed for fintechs.
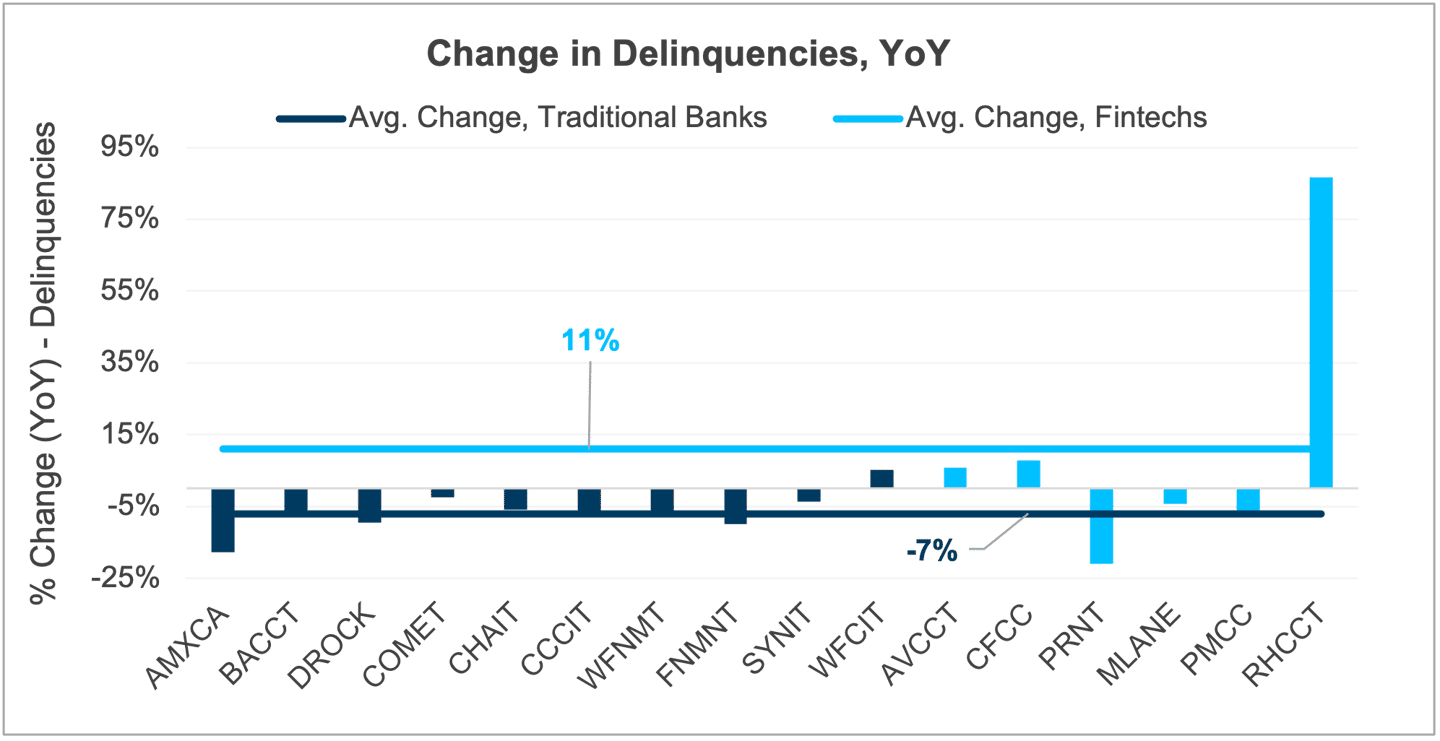
Source: Bloomberg, BofA Securities, J.P. Morgan Securities LLC, Fitch Ratings, KBRA, S&P Ratings, Offering Memorandums. Data is for July 2026 and July 2025. Delinquencies are 30+ day delinquencies. Change is calculated as the percentage increase or decrease from 2025 delinquencies level to 2026 delinquencies level. RHCCT data is for the five months ending May 2026 and the six months ending June 2025. PRNT data is for May 2026 and May 2025. PMCC data is for the six months ending June 2026 and the year ending December 31, 2025. Average Delinquencies, Traditional Banks: The average MPR of AMXCA, BACCT, DROCK, CHAIT, CCCIT, WFNMT, FNMNT, SYNIT, and WFCIT. Average Delinquencies, Fintechs: The average MPR of AVCCT, CFCC, PRNT, MLANE, PMCC, and RHCCT. Some fintech ABS were excluded due to not being agency rated.
The verdict?
Current delinquency trends remain within expected parameters and are broadly supportive of credit performance. Delinquencies in traditional bank credit card ABS trusts declined by an average of 7% from the prior year period. For fintech card ABS, average delinquencies increased by 11%, and was largely skewed by the performance of the Robinhood trust, which experienced rapid account growth. Excluding that portfolio, fintech trust delinquencies declined by an average of 4%.
Fintech-sponsored credit card ABS have delivered competitive credit performance, supported by charge-offs below base-case assumptions, robust trust yields and generally resilient payment behavior. Still, the sector has a shorter performance history, smaller transaction sizes, more limited ratings coverage and potentially lower secondary-market liquidity than the traditional bank card ABS.
For investors, selected senior fintech credit card ABS may provide incremental income and diversification within a professionally managed fixed income strategy. Careful security selection remains essential, particularly when evaluating collateral quality, structural protections, ratings, liquidity and alignment with investment policies. We will continue to monitor the sector as its performance history develops.
Markets
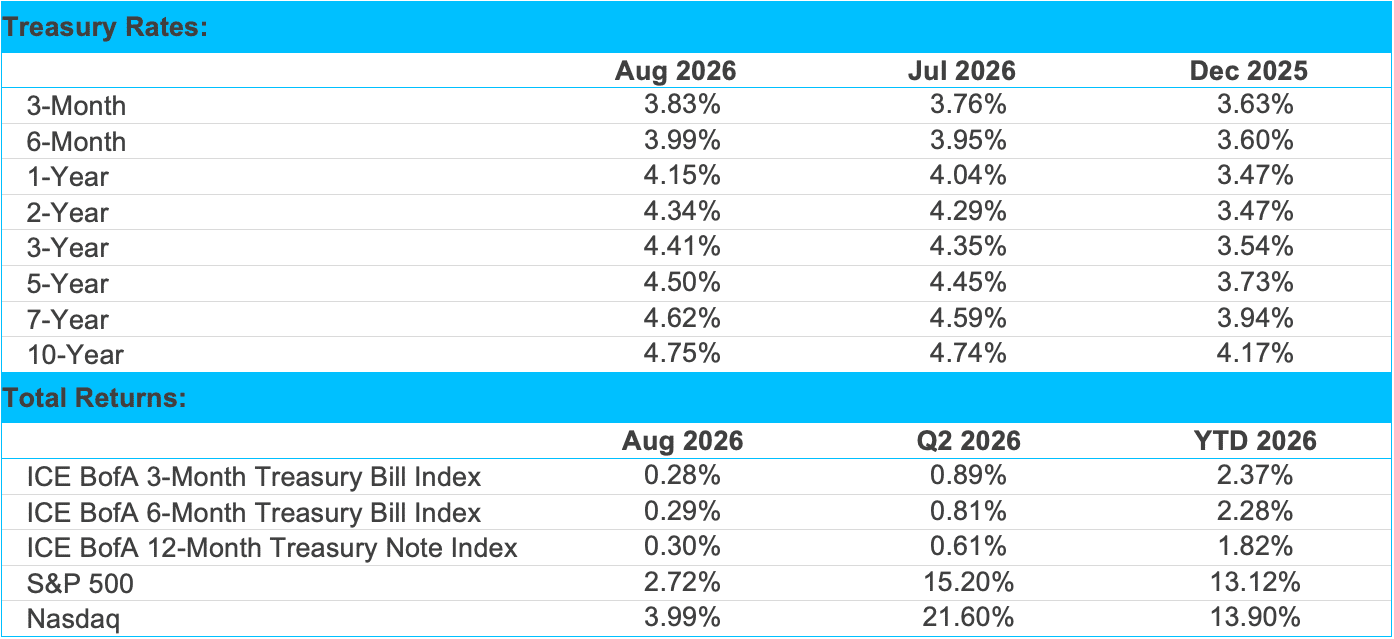
Source: Bloomberg and SVB Asset Management as of 08/31/2026.
Agency and corporate yields

Source: Bloomberg, Tradeweb and SVB Asset Management as of 09/01/2026.
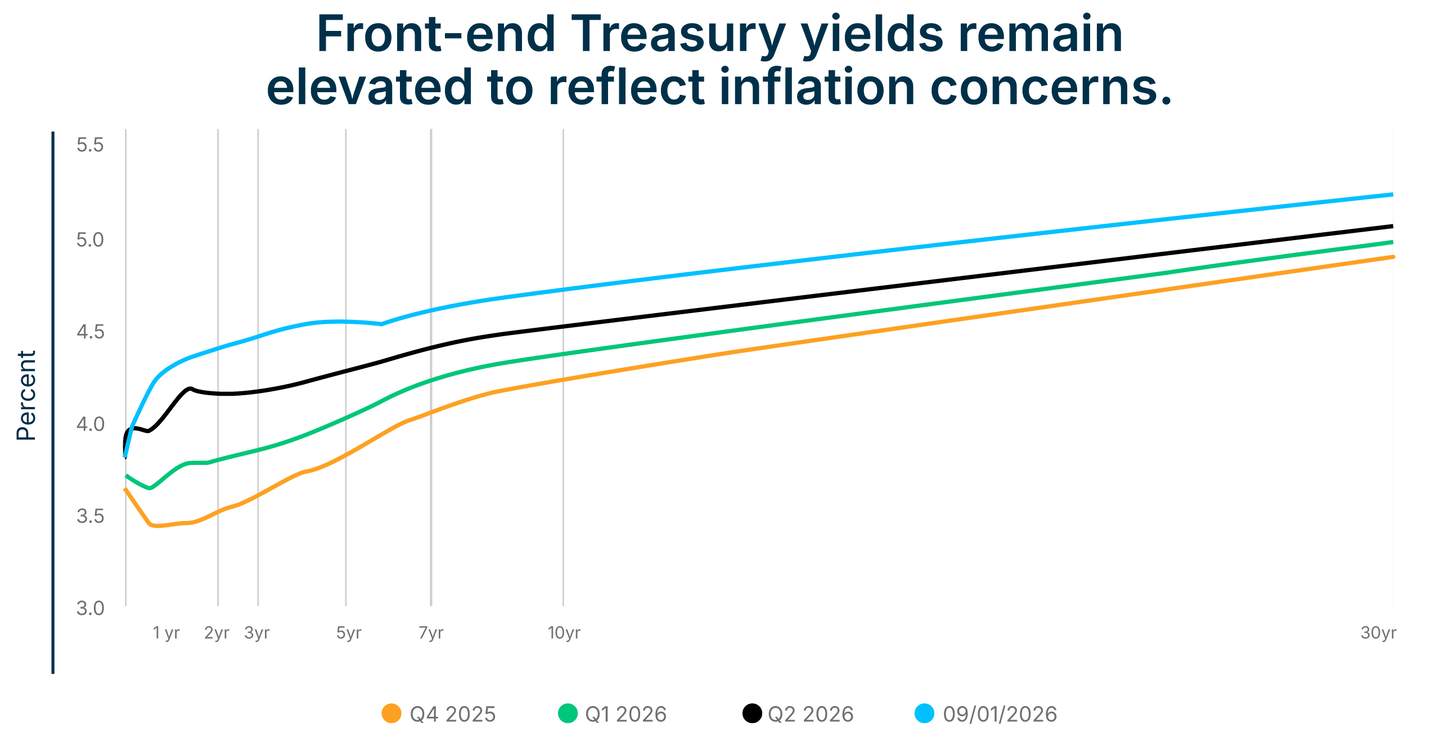
Source: Bloomberg, Tradeweb and SVB Asset Management as of 09/01/2026.
Economic indicators

Source: Bloomberg and SVB as of 09/11/2026. US Bureau of Economic Analysis and US Bureau of Labor Statistics. *Current GDP release as of 08/26/2026. †Quarter over quarter. **Consumer Price Index. ***Personal consumption expenditures. ‡Current PCE release as of 08/26/2026.

