
- The trading range in Treasury yields has been impressive in 2023. The four key factors influencing markets include: inflation; stress in the banking sector; the debt ceiling debate; and tight labor markets.
- Turmoil in banking appears to be contained, but tighter lending standards could slow growth and help the Fed cool off the economy.
- On the other hand, a look at the current negative “real” fed funds rate may be suggesting there could be more rate hikes ahead if inflation proves resilient.
This month’s main article, Shifting Focus, examines the factors that are contributing to today’s market uncertainties, and conflicting indicators of the economy’s health that make the Fed’s job to set rates more difficult.
Also included are the following themes:
- Credit Vista: Assessing the CRE storm clouds
- Trading Vista: Changing sentiment
Economic Vista: Shifting focus
Jon Schwartz, Senior Portfolio Manager
Markets are always moving. The same can be said for the factors that move the markets and the first half of 2023 has been no exception. First, consider what transpired during 2022 and fast forward to where we find ourselves after five months of 2023. Last year was defined by a punishing bond market selloff, which resulted in the worst total return performance for fixed income in the last 40 years. Although financial markets have enjoyed more stability this year, they have still experienced an exceptionally wide trading range. This reflects the uncertainty around four key factors that have been moving markets—and sentiment—to date this year. Let’s take a closer look at these four factors.
Inflation
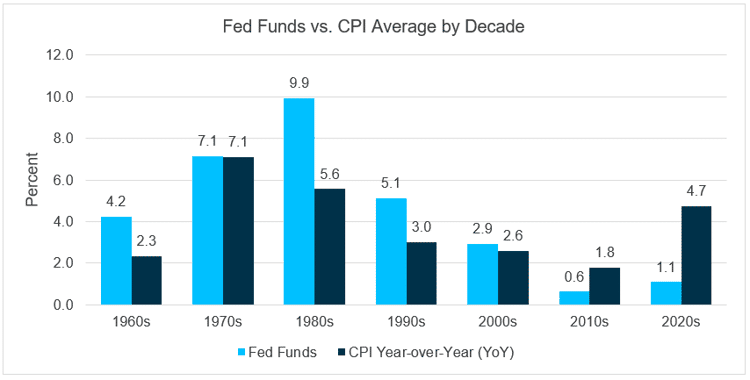
As 2023 began, investors were focused on the influences that rattled markets throughout 2022, most notably excessive inflation and a hawkish Fed intent on slowing consumer demand and reigning in rising price pressures. The Fed hiked rates aggressively from 0% to 4.375%, which helped lower CPI to 6.5% (down from a peak of 9.1% in mid-2022). Core PCE, the Fed’s preferred inflation measure, also came off its peak of 5.4% in early 2022 to a more modest but still high 4.6%. Clear progress had been made in the fight against inflation, but price pressures remained well above the Fed’s 2% target. Even with all the rate hikes, the real fed funds rate was still negative (6.5% CPI - 4.375% fed funds = -2.125% real fed funds rate). This meant consumers were still not incentivized to save. After all, if your dollars are going to lose purchasing power over the next year, you are more likely to spend until you can earn enough return elsewhere to overcome inflation.
Looking at the last seven decades, the fed funds rate has always exceeded inflation, except during the period beginning in 2010. This means we have had a negative real fed funds rate for more than 13 years, on average. The Fed was successful at taming inflation in the 1980s, at least in part, by disincentivizing spending with a positive real fed funds rate. This suggests the Fed has more work to do to bring inflation down, if history is any guide. Keep in mind, however, that the Fed is cautious about overshooting and causing a hard landing for the economy with an overly restrictive policy. As inflation corrects, the real rate should head higher, yet this crude measure suggests there could be more Fed rate hikes ahead if inflation proves to be resilient.
 Source: Bloomberg
Banking Stress
All things equal, the Fed was expected to continue hiking until strains in the banking sector took center stage. In March 2023, there were several bank failures and concerns about a broader contagion. The FDIC took swift action to protect depositors, but a major flight to quality ensued in the Treasury market with 2-year Treasury yields dropping from 5.07% to 3.77%, an extraordinary 130 basis points (bps) over a 16-day period. Subsequently, the market shifted once again and began pricing in over 100 bps of rate cuts by year end. Still, the Fed did not revise their forecast at the March FOMC meeting, but rather maintained expectations for the December (year-end 2023) fed funds of 5.10%. While the Fed left their funds rate projections intact, they saw the stresses in the banking sector largely contained but acknowledged that tighter lending standards would have a restrictive economic impact.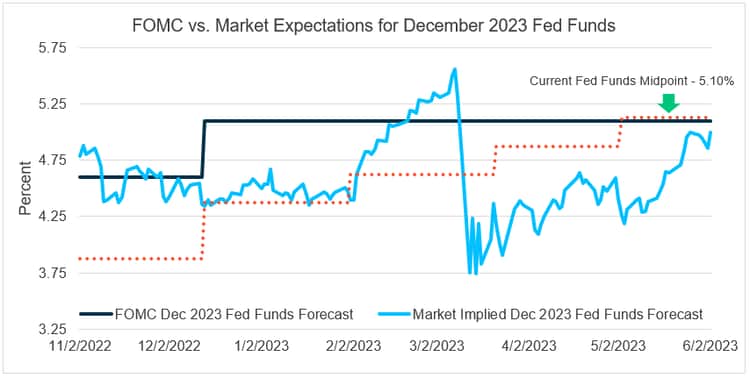
Source: Bloomberg
Debt Ceiling
As if bank failures were not enough for the market to contend with, contentious political debate regarding the debt ceiling was being closely watched. Fortunately, Congress averted a default by agreeing to a debt ceiling deal within days of the “x-date”. Had no deal been struck, this had the potential to wreak havoc on the global economy with truly unknown ramifications. As the deadline approached, market participants were positioning for a flight to quality, but with the crisis averted, yields across the curve have reverted to marching higher.
Strong Labor Markets
Another variable that the Fed has been watching is the continued resilience of labor markets. The most recent employment report showed 339,000 new jobs added in the month of May, far above expectations and bringing the monthly average job creation to a robust 314,000 for the first five months of 2023. The labor force participation rate remained steady at 62.6% and the JOLTS report, which measures job openings available in the market, increased from 9.7 to 10.1 million openings for the month of April. The rise from the prior month was a reversal and reflects higher demand for workers even as the unemployment rate ticked up from an all-time low of 3.4% to 3.7% in May. While there are some small signs of weakness, the tightness of the labor market remains in place.
Looking Ahead
So what can investors make of the cross-currents and uncertainties? The market started the year focused on the Fed and the fight against inflation, only to be derailed by concerns in the banking sector. Although a wider banking crisis was avoided, we still witnessed some of the biggest bank failures in U.S. history. Now, however, focus has shifted from the banking sector, at least temporarily, back to the original task at hand–fighting inflation while orchestrating a soft landing. But complicating matters has been a resilient economy and a labor market that remains tight. For the moment, expectations have shifted to no rate cuts in 2023. This could present opportunities to extend duration and lock in elevated yields for investment portfolios. But no matter how markets inevitably shift, it remains our goal to position portfolios appropriately across the entirety of the rate cycle, while preserving capital and maintaining adequate liquidity.
Credit Vista: Assessing the CRE storm clouds
Michael Duranceau, Credit Analyst
It appears that financial markets have generally moved on from their recent laser focus on banking sector stress. That’s old news. Now, headlines surrounding the U.S. commercial real estate (CRE) market are taking center stage. Investors have become increasingly concerned about vulnerabilities in this sector, and in particular, the outsized exposure that many regional and community banks currently hold. Is this the next looming crisis? Let’s take a closer look.
Bank Exposure
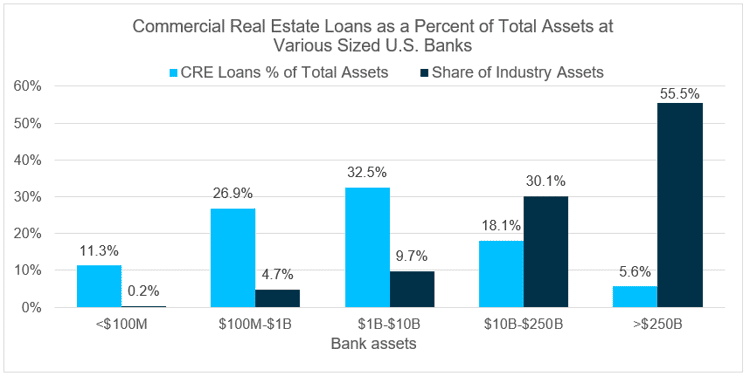
While the CRE lending business is relatively diverse and boasts an array of lenders and investors, traditional banks maintain significant exposure, holding approximately 60% of all commercial real estate debt in the U.S.1 Additionally, much of this is concentrated in regional (29% of total) and community banks (38%) across the country, with the remaining 33% held by the largest banks. While figures tend to vary given the general opaqueness of the market and lack of detailed disclosures, U.S. banks with under $250 billion in assets have CRE loan exposure averaging 22% of total assets, compared to under 6% at the largest banks.2
 Note: CRE includes all owner occupied and construction CRE loans. Total capital includes all Tier 1 and Tier 2 capital per definitions under U.S. regulations. Source: Fitch Ratings, Fed Fis
Regional and community banks tend to be more sensitive to deteriorating CRE loans given their high relative exposure and lower capital buffers to absorb potential losses. Additionally, these smaller banks typically have greater concentrations to certain risker types of CRE loans, such as office properties and construction, with the former category currently being one of the more stressed types of CRE due to a variety of macroeconomic factors.
While there has not been material CRE loan deterioration during the current credit cycle yet, the sector faces significant headwinds, including record high office vacancies, a large number of refinancings due over the next several years, and a tightening lending environment. Additionally, the impact of rising rates and a slowing economy will likely continue to weigh on the sector for some time.
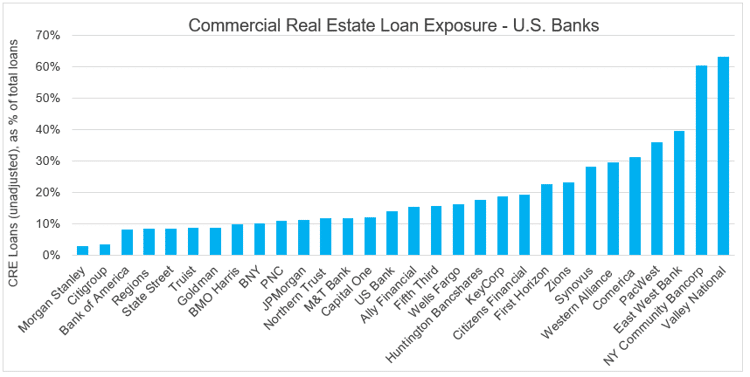 Source: Company presentations,10Qs, Bloomberg, SVB Asset Management. Data as of 3/31/2023. Includes both owner-occupied and non-owner occupied commercial real estate loans.
Office Vacancies
One of the most pressing issues facing the CRE market is bank exposure to commercial office properties, which consists of approximately 20-25% of the total sector.3 Offices have faced significant challenges since the height of the pandemic due to the emergence of work-from-home and hybrid work environments. This remote work phenomenon has resulted in high rates of office vacancies in many large cities, with the average U.S. office vacancy rate during the first quarter of 2023 hitting a 30-year high of 17.8%. San Francisco has one of the highest vacancy rates of any U.S. city at almost 30%, equating to roughly 35 million square feet of space not currently being used.4 Bank earnings commentaries for the first quarter of 2023 were cautious on commercial office properties overall, and many banks indicated they are increasingly concerned about the sector and will likely reduce lending levels given the murky outlook.
Industry experts anticipate vacancies to continue rising through the remainder of 2023 and into 2024 as the industry rebalances and companies continue to shed office space. The large amount of upcoming loan maturities will also require many owners to refinance or modify their loans at higher rates, which will only add additional stress to the sector. Over 17% of all outstanding CRE loans are set to mature this year, and 23% of those maturing loans are office properties.5 Over the next three years, roughly one-third of all outstanding CRE loans are scheduled to mature, or approximately $1.5 trillion.6
Looming Delinquencies?
CRE loan delinquency rates across all commercial banks increased from 0.69% in the fourth quarter to 0.76% in the first quarter of 2023, according to Federal Reserve data. The negative trend has continued into the second quarter, with the real estate analytics firm, Trepp, reporting that more than 3.38% of commercial office loans are seriously delinquent (>90 days past due) as of May. While delinquency rates are still well below historical averages, they have increased materially from a year ago, and there is wide agreement that delinquencies and defaults will continue as pressure mounts in the sector.
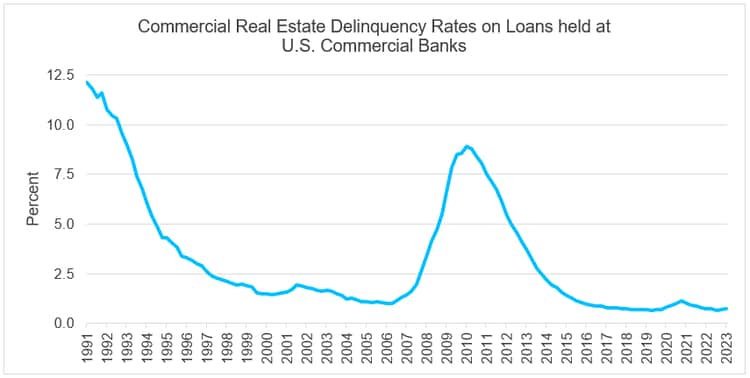 Source: Board of Governors of the Federal Reserve System (US), Delinquency Rate on Commercial Real Estate Loans (Excluding Farmland), Booked in Domestic Offices, All Commercial Banks [DRCRELEXFACBS], retrieved from FRED, Federal Reserve Bank of St. Louis; https://fred.stlouisfed.org/series/DRCRELEXFACBS, June 7, 2023.
Despite the slight uptick in delinquency rates, net charge-off rates for commercial real estate loans at the 100 largest U.S. banks remain near historic lows. Net charge-offs in the first quarter of 2023 were 0.11%, up from 0.01% a year earlier, though still well below the long-term average of 0.32%, according to Federal Reserve data.
Office sector-specific delinquencies also remain at historic lows, though the sector has seen increases this year and remains well above the overall CRE delinquency rate. According to data by Trepp, delinquency data showed an 80-basis point increase in the overall CMBS office delinquency rate from December 2022 to February 2023.
While increasing losses are anticipated, we expect any impact to be manageable for most banks given the very low current base level, relative strength in the rest of the CRE sector, and strong capital position of the overall banking sector. In addition, banks have already begun to set aside more loan loss reserves to address the potential for increasing losses and the impact from a general slowdown in the economy. As a result, most banks should be well-positioned to absorb additional charge-offs without an unexpected hit to capital levels.
The chart below illustrates the rise in loan loss reserves for U.S. banks since 2022, which reflects their expectation of increasing losses from non-performing loans.7 While loan loss provisions decreased during the first quarter of the year across the broader banking sector, many of the largest banks still reported quarter-over-quarter increases due to a weaker economic outlook and signs of emerging stress in certain areas of lending, including parts of CRE.
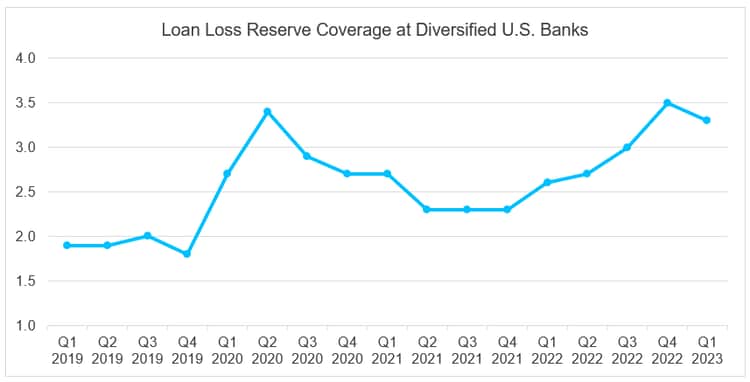 Source: Bloomberg, company filings. Data as of 3/31/2023.
Some smaller regional banks with higher concentrations of stressed CRE loans and lower capital buffers could encounter increased difficulties, though any negative impact would likely be contained to a narrow section of the financial markets.
What to Expect
While a modest increase in delinquencies across the entire CRE space over the next several quarters is expected, we view the greatest impact will be contained to the office properties sector. Any potential losses should be manageable for most banks, and we do not anticipate a negative impact to the broader U.S. economy, nor do we anticipate any material credit rating downgrades. Large U.S. banks on average have relatively modest exposures to office CRE, and the majority of other CRE sectors currently have stronger fundamentals compared to office properties and should continue to perform well as the credit cycle shifts. Additionally, both regional and large U.S. banks overall have solid credit fundamentals, including stable asset quality, excellent liquidity, and capital well above minimum regulatory required levels.
Thus, we anticipate any potential downturn to be limited in scale when compared to previous CRE sector issues during the late-1980’s and mid-2000’s. Bank CRE activity has shifted dramatically over the past decade to less risky lending, including lower leverage and loan-to-value ratios. CRE industry concentration has also shifted from riskier construction and development financing, to increasing exposure in multi-family lending, which tends to be more stable. Vacancy rates outside of the office sector remain low at less than 5% in most CRE sectors, and less than 3% in industrial.8
In summary, we remain comfortable with the majority of U.S. bank exposure to the broader CRE market. While we are cautious on office properties in particular given numerous headwinds and the potential for increasing delinquencies and losses, we view the situation as manageable and see limited potential spillover to other areas.
Trading Vista: Changing sentiment
Jason Graveley, Senior Manager, Fixed Income Trading
“Data dependency” and all its implications really has a way of flipping market sentiment. It was about this time last month when our market commentary was more centered on how long the Fed could hold at the current fed funds target range before undertaking an easing cycle. But after nonfarm payrolls surprised to the upside—again—the resiliency of the labor market has buoyed rate expectations. When coupled with the recently signed bipartisan agreement to the debt ceiling, it’s no surprise that the conversation has skewed toward additional tightening. In fact, some market strategists had even reopened the door for another rate increase as early as the June FOMC meeting. Although the Fed did pause on increasing the target rate in June, the hawkish tone has many believing there will be further tightening this year. If we look at the bond forecasts for most major banks, which is aggregated and published on Bloomberg, most analysts were projecting a 2-year yield of close to 4% at the end of this quarter. However, 2-year rates are currently trading closer to 4.65% at the time of this writing.
While we have seen a surge higher in rates over a short period, more than a 50-basis point (bps) gain in May, it’s important to remember that there are a number of events and releases that will help frame the discussion over the next couple weeks. This includes two upcoming inflation prints and a jobs report ahead of the July FOMC meeting, as well as further insights via Fed speeches. And while market uncertainty and downside risks seem much more minimal now–after all, how much higher does the Fed really want to go–investors remain in a wait-and-see pattern. For evidence, consider that government money market funds have surged more than $230 billion higher this year, and even weekly data provided by Crane supports the theory that investors are still comfortable being on the sidelines with money market funds yielding close to 5%.
Separately, the front-end of the yield curve could look much different with the debt ceiling resolution in the rearview mirror. Analysts’ estimate that the Treasury could add over $1 trillion in net bill issuance in coming months, and although there are natural buyers through money market funds and foreign investors that are underweight relative to historical allocations, the overall supply is expected to put upward pressure on yields at the front end of the curve (the 6-month Treasury bill currently yields 5.50%). Commercial paper and tri-party repo offerings are two areas where the effect could be most pronounced as we see some potential for spillover if the risk-free comp jumps in yield. So, while uncertainty has waned and markets seem content post debt-ceiling resolution, there is plenty to digest in the short term. We’ve seen sentiment shift quickly and volatility could re-emerge and change market expectations again. We’ll be ready.
9Sources: Crane Money Fund, data as of 6/02/2023, Bloomberg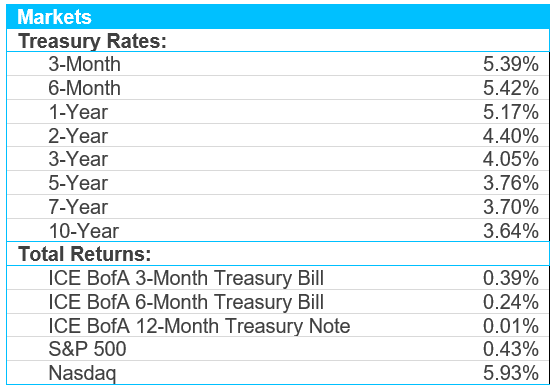 Sources: Bloomberg and Silicon Valley Bank as of 5/31/2023.
2Source: Fitch Ratings, Federal Reserve. Data as of 3/31/2023.
3Source: Financial Times, Mortgage Brokers Association
4Source: CBRE office demand report dated 5/1/23
5Source: Mortgage Bankers Association
6Source: Trepp Analytics data
7Source: Bloomberg
8Wells Fargo Research Data


