
- The mechanics of U.S. Treasury bond auctions have been created to ensure transparency and fairness, because ultimately these auctions have far-reaching implications for global financial markets.
- The purpose of these bond auctions is to raise funds for the government to cover budgetary deficits and finance various initiatives. But the outcomes of these auctions are a barometer that also shapes the yield curve.
- Treasury auctions remain under scrutiny by investors for clues on the inflation outlook, future monetary policy, and the overall strength of the economy.
This month’s main article, Going Once, Going Twice…, discusses the mechanics of the U.S. Treasury bond auction and its critical role in the market as an influencer of interest rates, yield curve dynamics, and global investor sentiment.
Economic Vista: Going Once, Going Twice…
Jose Sevilla, Senior Portfolio Manager
Watching a live auction can be great theater. It’s high energy and fast paced. There’s competition among bidders. And it’s a great way to determine a fair market price. Through that lens, perhaps it’s no surprise that one of the primary mechanisms through which the U.S. government raises funds is the Treasury bond auction. Because the U.S. Treasury bond market plays such a pivotal role in the global financial system, we wanted to dive into the mechanics of the U.S. Treasury bond auction, highlighting the process, the implications it has on global financial markets and yield curve, and the current dynamics that have brought heightened attention to these auctions.
Transparency & Fairness
The U.S. Treasury bond auction is a process by which the government raises money by issuing new government debt securities, which investors bid on and purchase. The Department of the Treasury determines the size and terms of the auction, which typically occur on a regular schedule. The key steps in the auction process include announcement, bidding, allocation, and issuance.
The process begins when the Treasury Department announces the details of the upcoming auction, specifying the type of security, maturity date and the amount to be issued. To participate in the auction, investors, including banks, institutional investors and individual investors submit competitive and/or non-competitive bids. Competitive bids specify the desired interest rate, while non-competitive bids agree to accept the average market yield determined at the auction, which is ultimately calculated from the competitive bidding process. The purpose for this dual-bidding system is to ensure a fair and transparent process for determining government borrowing rates.
Allocations to investors are then made, and the final terms are based on the interest rates determined at the auction. For competitive bidders, the Treasury department accepts bids starting with the lowest interest rate, working upwards until the total bonds offered are filled (i.e., sold). Because non-competitive bidders accept the average market yield, they will typically receive their full allocation, provided their orders do not exceed the total available bonds for the non-competitive bids.
The auction concludes when all the competitive and non-competitive bids have been received and processed. Once the auction is complete, the Treasury department issues the bonds to the winning bidders. Investors who won the bid are required to pay the purchase price for the bonds they were allocated. For the competitive bidders, this is the price based on their specific bid at the auction, but for non-competitive bidders, their purchase price is based on the average market yield. Therefore, demand (or lack thereof), can impact the prices paid for non-competitive bidders.
The practical purpose of U.S. Treasury bond auctions is to raise funds for the government to cover budgetary deficits and finance various initiatives. The funds collected from bond sales help the government meet its spending requirements. Beyond that, however, the outcomes of these auctions also have profound implications for other global financial markets and the yield curve.
Setting the Curve
The yields determined from the Treasury auction serve as a benchmark for interest rates across financial markets, which influences the pricing of various financial instruments, including corporate bonds, home mortgage loans, and all types of consumer and business loans. The yields established at the auctions also influence the overall interest rate environment. Higher yields may indicate reduced demand for government debt, signaling concerns about inflation or economic uncertainty. Consequently, under-, or over-subscribed auctions can shift Treasury prices and yields and, by extension, impact the shape and dynamics of the yield curve.
The demand for U.S. Treasuries at the auctions also typically reflects investor sentiment and expectations for the economy. We all know U.S. Treasuries bonds are considered among the most liquid and safest investments in the world, and thus the interest they pay is often referred to as the “risk-free rate” (even though we all know there is no such thing!). Changes in demand for these bonds at auction can influence overall market liquidity and serve as a barometer for investors' risk appetite. Strong demand may indicate a preference for safety, while weak demand may suggest a willingness to take on higher-risk investments.
In recent times, U.S. Treasury auctions have garnered increased attention from market participants. Several factors have contributed to this heightened scrutiny:
- Inflation Concerns: The specter of inflation has become a significant concern in financial markets, particularly in the immediate aftermath of the pandemic when fiscal and monetary policies fueled robust demand for goods just as energy prices were spiking. This was a potent combination, and inflation proved to be more than just “transient.” This ultimately drove the Federal Reserve to launch its aggressive rate-hike campaign. Investors have been closely monitoring Treasury auctions for signals of rising or abating inflation expectations, as higher yields may reflect a perceived need for compensation against eroding purchasing power.
- Monetary Policy: The actions and statements of the Federal Reserve play a pivotal role in shaping market expectations. Investors keenly observe Treasury auctions for insights into the Fed's stance on interest rates, as these auctions can reflect the interplay between market forces and central bank policy.
- Global Economic Uncertainty: Geopolitical events, trade tensions, and global economic uncertainties can drive demand for safe-haven assets like U.S. Treasury bonds. Increased volatility in global markets heightens the significance of Treasury auctions as a barometer of investor risk sentiment.
In summary, the mechanics of U.S. Treasury bond auctions are not only intricately tied to the government's financing needs, but they have far-reaching implications for the broader financial markets. As a critical market function, these auctions influence interest rates, yield curve dynamics, and investor sentiment. In fact, machinations in these bond auctions can have ripple effects around the world. The current focus on our U.S. Treasury auctions is a sign of the times, and investors continue to watch closely for clues about the trajectory of inflation, Federal Reserve policy and the overall health of the U.S and global economies. These auctions serve as a key indicator for the health and stability of the global financial system.
Credit Vista: Industrial Corporate Credit Health Check
Timothy Lee, CFA, Senior Credit Analyst
Healthy isn’t a word typically associated with the pandemic. But ironically, the effects of COVID-19 have left industrial corporate credit healthy and seemingly able to withstand any potential economic slowdown over the next year.
For our credit health screening, we aggregated fundamental data from 803 investment-grade industrial issuers who were constituents of the ICE BofA US Corporate Index as of December 1, 2023, excluding issuers in the utility and financial sectors.
After falling 5% in 2020 at the start of the pandemic, total aggregate revenue bounced 18% in 2021 and grew another 12% in 2022 before flatlining at a mere 1% growth during the most recent trailing 12 months for 2023. However, trailing 12-month revenue in 2023 still stands 26% higher than 2019 levels, as companies have benefitted from strong pricing power over the last two years. Looking ahead, revenue growth may be poised to fall, particularly if pricing power wanes and volumes decline. Nevertheless, it’s important to keep perspective and acknowledge that revenue should remain at healthy nominal levels.
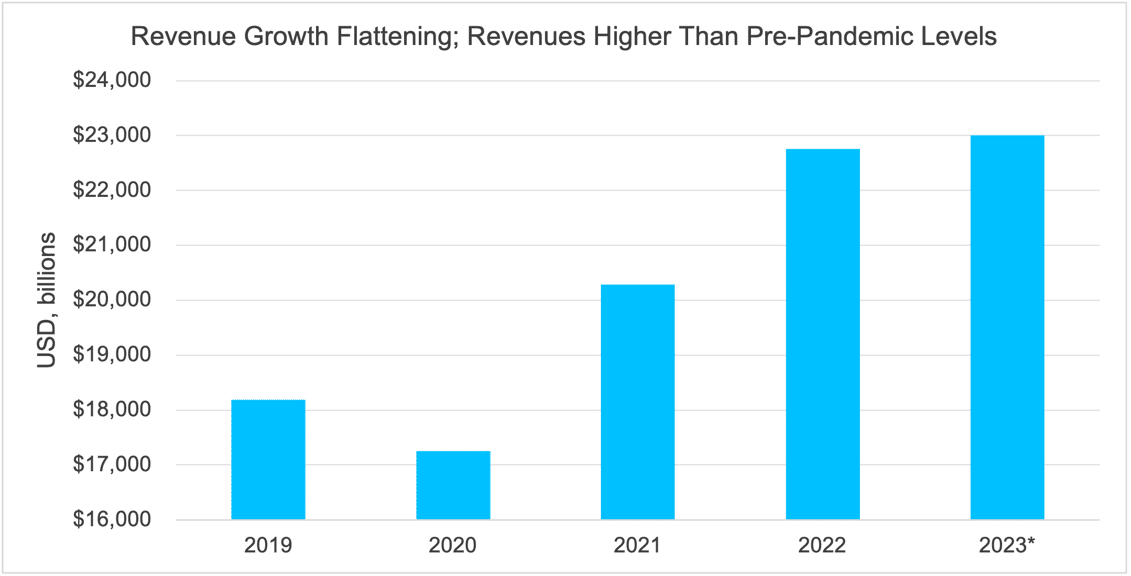
Source: Bloomberg, ICE BofA US Corporate Index (C0A0), Aggregate Revenue, Industrials and SVB Asset Management. Data as of 12/1/2023. *Most recent aggregated reported trailing 12-month revenue as of 12/1/2023.
Similar to revenue, Earnings Before Interest, Taxes, Depreciation and Amortization (EBITDA) margins also fell in 2020 before rebounding sharply and peaking in 2021. The median EBITDA margin has normalized back to 2019 levels, in part due to elevated inflation and higher input costs.
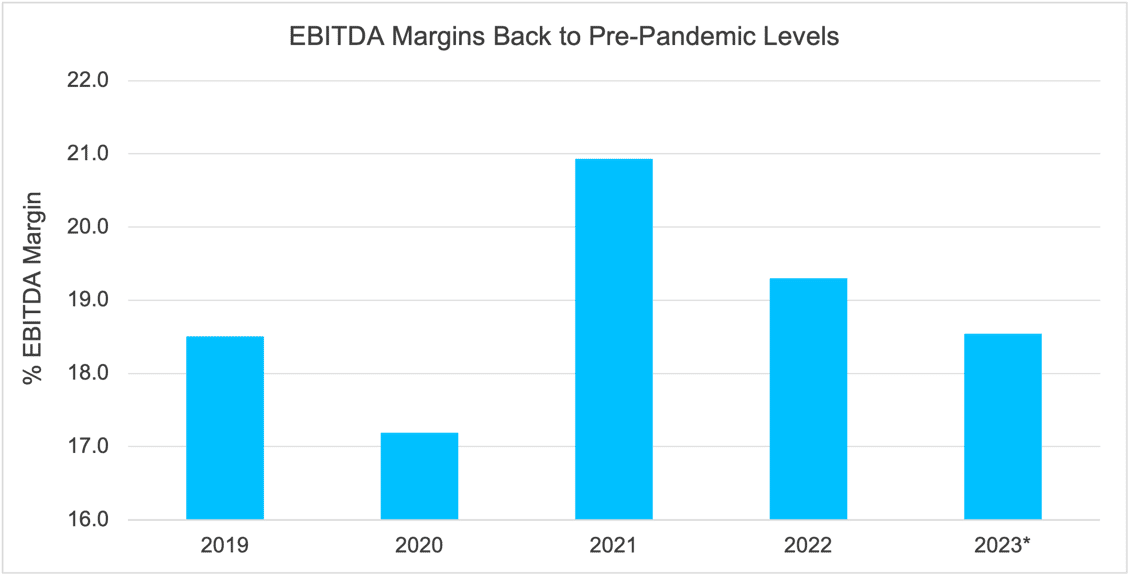
Sources: Bloomberg, ICE BofA US Corporate Index (C0A0), Median EBITDA Margin, Industrials, and SVB Asset Management. Data as of 12/1/2023. *Most recent aggregated reported trailing 12-month figures as of 12/1/2023.
Some sectors, though, have fared better than others when it comes to margins. In particular, the energy sector has been helped by higher petroleum prices and efficiency gains, while the automotive sector has benefitted from solid demand and restrained supply. In contrast, the median EBITDA margin has declined in the media sector, which is dealing with competition for advertising dollars, higher content creation costs and general industry disruption from the rise of the direct-to-consumer model. In the healthcare sector, hospitals and healthcare facilities have yet to recover from the strains caused by the pandemic.
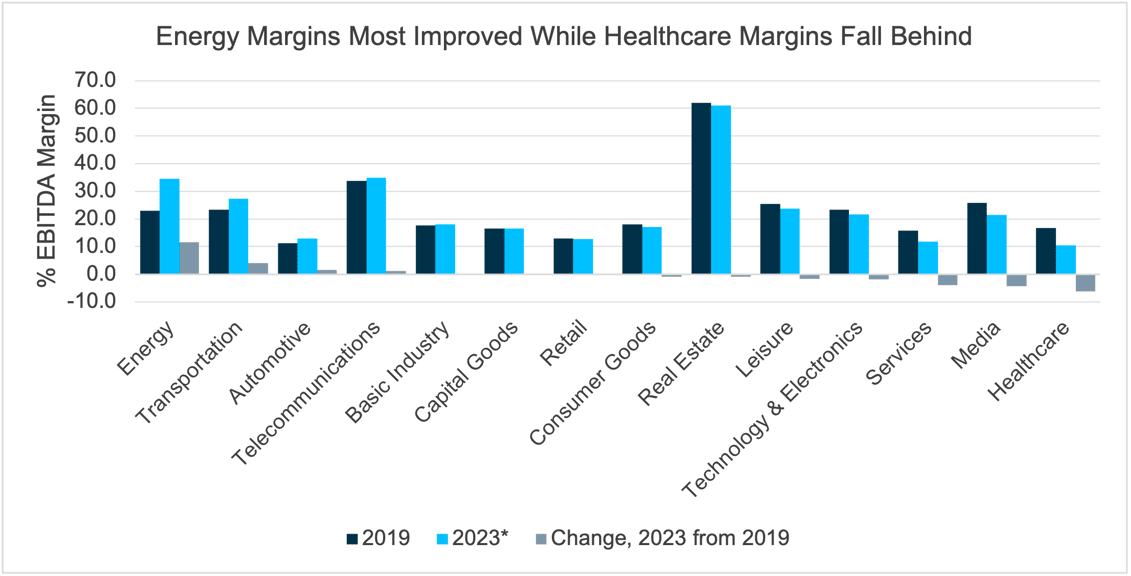
Sources: Bloomberg, ICE BofA US Corporate Index (C0A0), Median EBITDA Margin by Industrial Sector and SVB Asset Management. Data as of 12/1/2023. *Most recent aggregated reported trailing 12-month figures as of 12/1/2023.
One of the most important metrics we use to gauge the health of a business is free cash flow generation, which remains robust amongst investment-grade industrial issuers. Aggregate free cash flow generation peaked during the middle of the pandemic, as companies curbed capital expenditures and other long-term investments while cutting costs to aid operating cash flow. Concurrently, repurchase spending fell 35% in 2020 from the prior year, while dividend spending fell nearly 9%. Dividends and repurchases gradually picked up as free cash flow generation steadied above pre-pandemic levels, but they remained below free cash flow levels. Even if free cash flow generation remains below peak pandemic levels, we expect repurchase spending to decline as well, and this should help industrial issuers maintain their strong credit profiles.
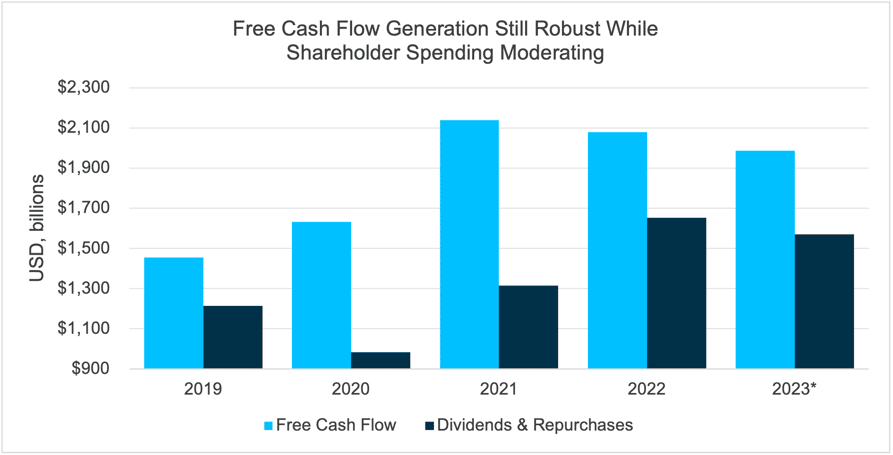
Sources: Bloomberg, ICE BofA US Corporate Index (C0A0), Aggregate, Industrials and SVB Asset Management. Data as of 12/1/2023. *Most recent aggregated reported trailing 12-month figures as of 12/1/2023.
Investment-grade industrial issuers also boast strong liquidity. Cash and short-term investments sit well above 2019 levels and provide a liquidity buffer against any economic slowdown. Plus, these higher cash balances are now a legitimate income-generating asset thanks to today’s higher interest rates.
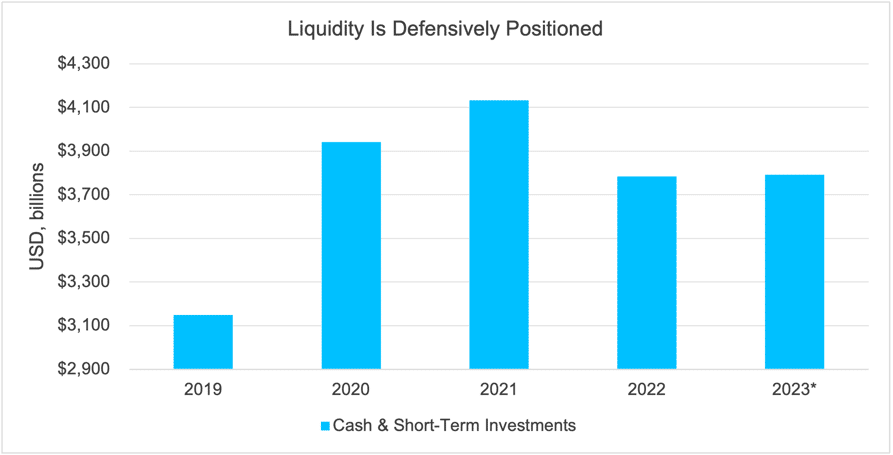
Sources: Bloomberg, ICE BofA US Corporate Index (C0A0), Aggregate, Industrials and SVB Asset Management. Data as of 12/1/2023. *Most recent aggregated reported figures as of 12/1/2023.
Rising interest rates also helped to push many corporate pension funding ratios above 100%. The fully funded status of corporate pensions has improved the debt profiles for issuers that carry defined benefit liabilities. Even if interest rates head lower, we expect pension funding ratios will continue to be much better than pre-pandemic levels and will stay near fully funded status as some corporations have taken advantage of the recent high-rate environment to hedge their funded status.
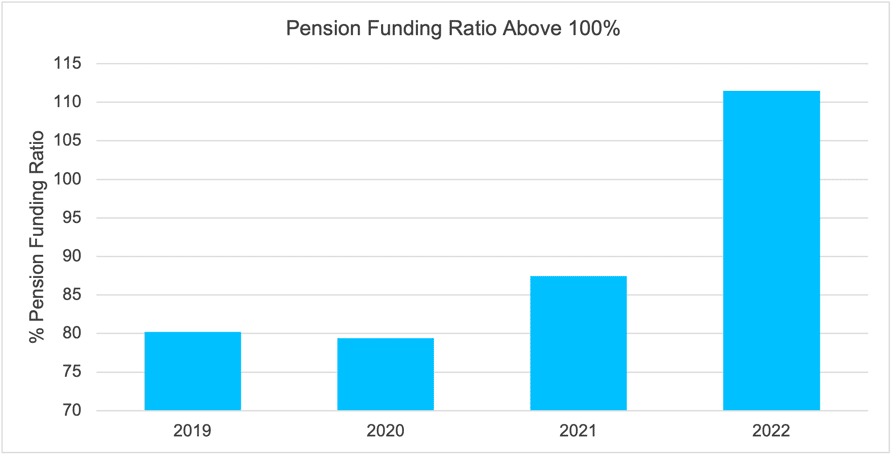
Sources: Bloomberg, ICE BofA US Corporate Index (C0A0), Average, Industrials and SVB Asset Management. Data as of 12/1/2023.
Although U.S. interest rates have recently risen to levels not seen in more than a decade, interest coverage levels are still stronger than in 2019 even though the overnight federal funds rate was less than half of 2023’s peak levels.
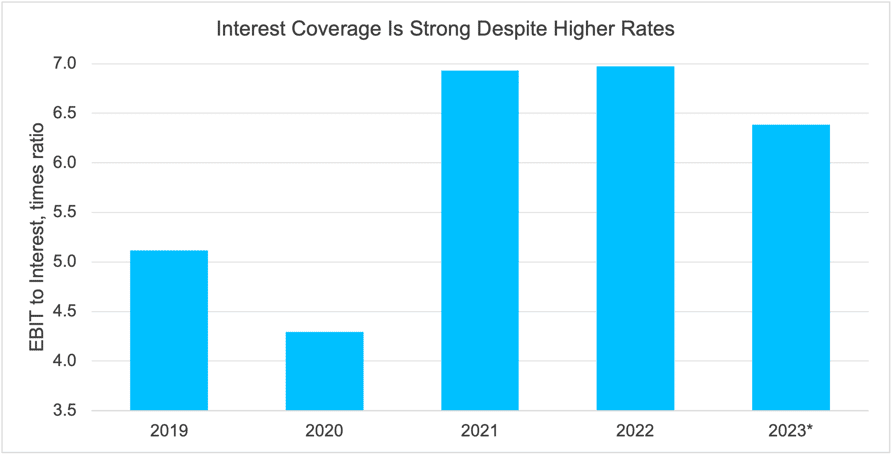
Sources: Bloomberg, ICE BofA US Corporate Index (C0A0), Median, Industrials and SVB Asset Management. Data as of 12/1/2023. *Most recent aggregated reported trailing 12-month figures as of 12/1/2023.
Thanks to savvy management, many industrial companies capitalized on the low-rate environment in 2020 and 2021 and refinanced their debt before the Fed began hiking rates in 2022. Sectors with the most improved interest coverage ratios include automotive, energy, and technology and electronics. Not surprisingly, the healthcare sector is at the other end of the spectrum and showed a decline in interest coverage, reflecting weaker earnings at hospital and other healthcare facilities.
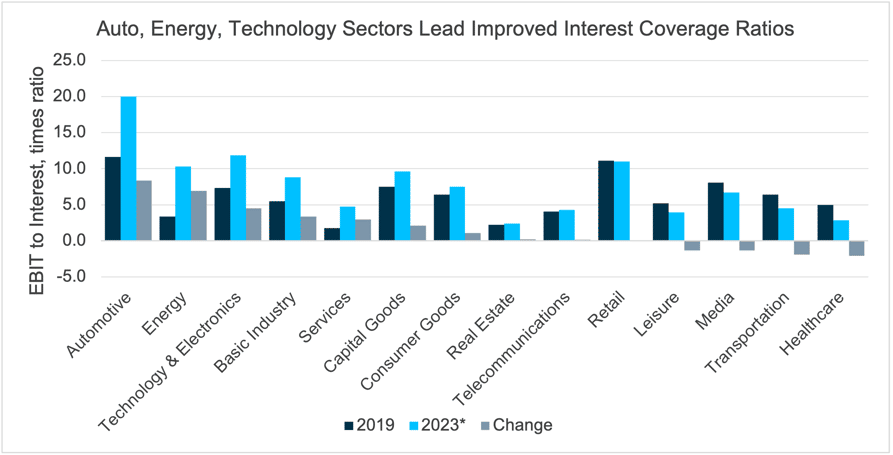
Sources: Bloomberg, ICE BofA US Corporate Index (C0A0), Median by Industrial Sector and SVB Asset Management. Data as of 12/1/2023. *Most recent aggregated reported trailing 12-month figures as of 12/1/2023.
While interest coverage improved across most sectors, net leverage has remained steady. Energy was the exception, with the median trailing 12-month net leverage dropping to 1.2x as of the latest reporting period in 2023, a decline of 0.7x from the 2019 median net leverage of 1.9x. Leverage rose the most in the leisure sector as hotels carried more debt.
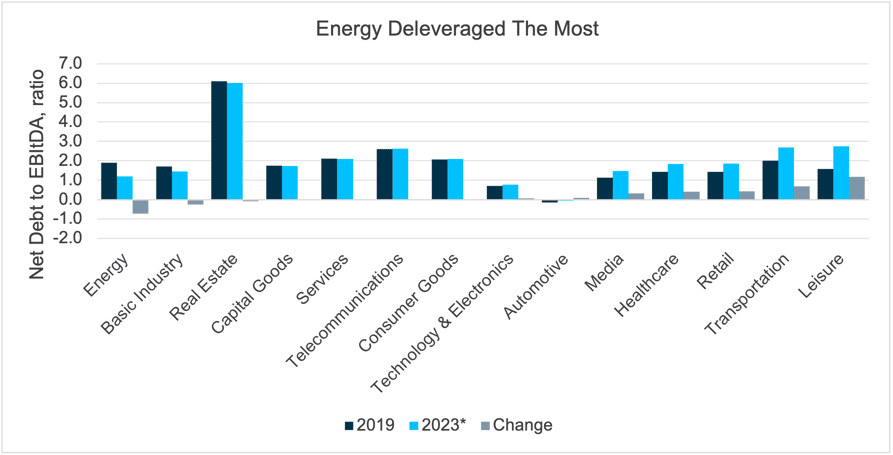
Sources: Bloomberg, ICE BofA US Corporate Index (C0A0), Median by Industrial Sector and SVB Asset Management. Data as of 12/1/2023. *Most recent aggregated reported trailing 12-month figures as of 12/1/2023.
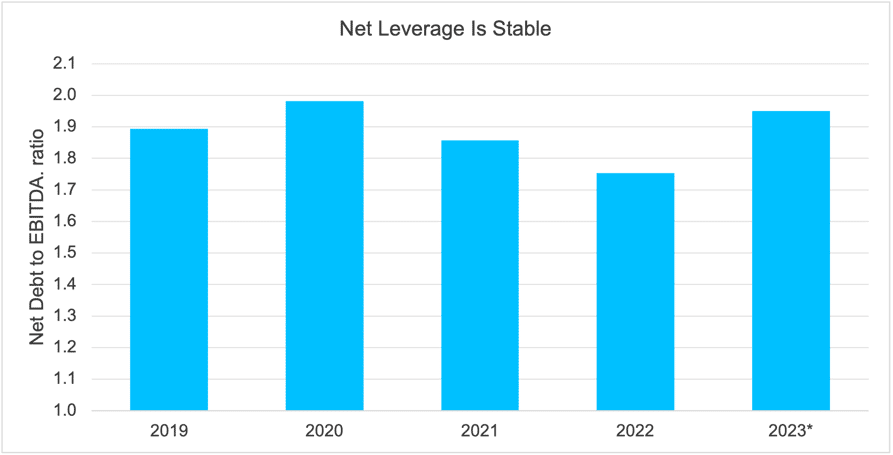
In aggregate, net leverage has been remarkably steady through an unsteady period, exemplifying shrewd credit management by investment-grade industrials. The median net leverage peaked at 1.98x at the height of the pandemic in 2020 before dropping to 1.75x thanks to a strong economic recovery in 2022.
So, what’s in store for 2024? Our temp check suggests that industrials remain remarkably healthy, particularly given the all the ups and downs of the past several years. First there were pandemic-driven shelter-in-place closures and crippling supply chain disruptions. Then we had monetary and fiscal stimulus that fueled demand. Then there was rampant inflation and the subsequent aggressive rate hike response. Yet somehow, the industrials have navigated these challenges, except for a few subsectors that remain challenged. Through it all, the median net leverage sits at 1.95x, not far from the 1.89x median net leverage in 2019. We believe investment-grade industrial corporate credit is well positioned for the year ahead.
Sources: Bloomberg, ICE BofA US Corporate Index (C0A0), Median, Industrials and SVB Asset Management. Data as of 12/1/2023. *Most recent aggregated reported trailing 12-month figures as of 12/1/2023.
Trading Vista: Pivoting into 2024
Jason Graveley, Senior Manager, Fixed Income Trading
There’s no doubt about it—2023 was yet another year of monetary policy focus. Investors not only weathered the latter stages of an aggressive tightening cycle, but they also were forced to decipher FOMC minutes and Federal Reserve speeches for clues on the ultimate terminal rate and how that might impact fixed income portfolios going forward.
The root cause of all the rate-hikes, of course, was the surging inflation that peaked at a 40-year high in 2022 and proved to be far more than “transient” as the Fed had previously hoped. This past year commenced with a 25-basis point (bps) rate hike in January, which was actually the first sign that the Fed was easing off the gas after a steady diet of 50- and 75-bps increases throughout the second half of 2022. Much like 2022, this past year was all about watching the economic data and the Fed to determine when and where the rate hikes would finally stop.
Although inflation is still above the Fed’s long-term target of 2%, we can unequivocally say that progress has been made to contain prices, with headline inflation falling from 3.7% in September to 3.1% in November (the most recent data at time of writing). Nevertheless, the market’s guessing game as to where inflation—and subsequently the Fed Funds rate—would level out resulted in a fair bit of Treasury volatility through much of the year. The on-the-run 2-year treasury hit a high of 5.22% and low of 3.77% in October and March, respectively. And while rate expectations have shifted with each economic print and realigned around FOMC guidance, the outlook for next year has skewed entirely toward potential rate cuts. Fed funds futures are showing a 65% chance that the Fed pivots to rate cuts as soon as the second quarter of 2024.
So how does this backdrop affect the next year’s outlook? Generally, rates are expected to fall next year, although there is significant dispersion around the time and extent of potential eases. This is likely to weigh on the primary market as current projections show that net new issuance is expected to decline due to a large schedule of debt maturities. U.S. financials will be in the market despite elevated funding costs due to regulatory requirements, but non-financial companies with healthy balance sheets and cash on hand are more likely to opportunistically target issuance closer to the start of an easing cycle (and when the curve inversion has historically been most pronounced). Money market fund balances are likely to remain elevated while the Federal Reserve stresses the importance of its data dependency mantra, but we have already seen a broader shift to add duration as the end of the cycle begins to materialize. While 2-year yields have moved down to roughly 4.3% at the time of this, more than 90 bps lower than their 2023 high, it’s important to remember that these are still some of the highest rates since before the global financial crisis. And with money market funds likely to reflect rate cuts more quickly in net yields, this may create an opportunity to lock in a higher returning book yield for a longer period, especially given a potentially lower rate and supply outlook on the horizon. As always, we’ll be watching for opportunities as the calendar year turns.
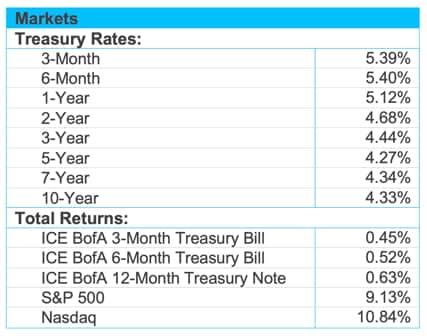
Source: Bloomberg and Silicon Valley Bank as of 11/30/2023.


