

- Thomas Edison once said, “Opportunity is missed by most people because it is dressed in overalls and looks like work.” There’s plenty of work ahead in today’s confusing market, but there might be a pathway to capture attractive yields, too.
- Three market phenomena — market volatility, increased supply and money market fund (MMF) dynamics — are conspiring to create a bevy of challenges.
- The relentless increase in Treasury supply, among other factors, has put downward pressure on prices, but it also has created buying opportunities for buy-and-hold investors.
This month’s main article, Challenges Yield Opportunities, observes that while not exempt from market volatility, fixed income markets can potentially provide incremental yield for corporate cash investors, and challenges seen in this environment may result in more opportunities.
Please also be sure to read this month’s Trading Vista, Locking in Longer (Duration).
Economic Vista: Challenges Yield Opportunities
Patty Kao, Head of SVB Asset Management
For those of us in the innovation economy (and really, for just about everyone), it is rarely comforting to see stock market declines and increased volatility. These occurrences coincide with a more difficult funding environment and greater economic uncertainty, which tends to make life difficult for corporate treasury teams.
But it’s not all bad news. For treasury teams that are well-positioned with strategic cash, some of these challenges can potentially be hidden opportunities. As we drill down into the fixed income markets, we explore three market phenomena: elevated market volatility, increased supply and unusual dynamics in the money market space. These aspects certainly don’t seem attractive at first blush; however, with the right approach and sound decision-making, they might provide a small tailwind to capture incremental yield.
Heightened Treasury Market Volatility
You may have noticed that news outlets have been highlighting the increased volatility in the Treasury market. This is partially a consequence of the fastest rate hiking cycle in history, along with the fact that today’s higher yields have made Treasuries much more interesting to trade. The MOVE Index — a common measure of bond market volatility — clearly illustrates how Treasury market volatility has spiked during the rate-hike cycle.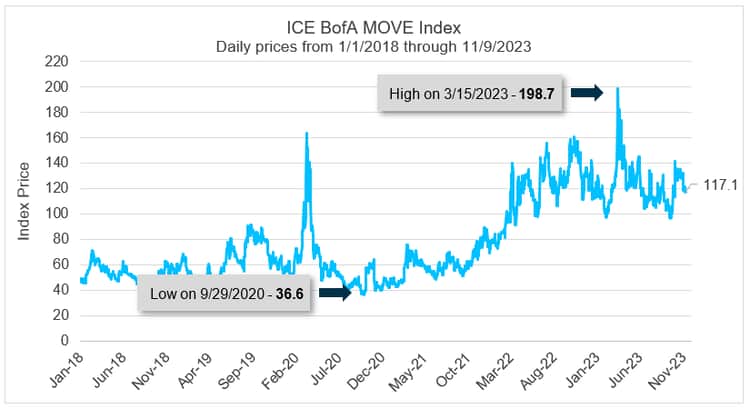
Source: Bloomberg and ICE BofA MOVE Index. Data as of 11/9/2023.
As we (hopefully) near the end of the Federal Reserve’s tightening cycle, the fine-tuning phase is still clouding the outlook and whipsawing investors. Every meaningful economic data release and all the “Fed speak” is shifting expectations and contributing to the volatility. For instance, longer-dated Treasuries sold off in dramatic fashion in late October, only to bounce back after the November 1 Federal Open Market Committee (FOMC) meeting.
Although front-end volatility is and will be muted compared to the full Treasury yield curve, the underlying volatility makes trading more interesting with opportunities for investors with different views, objectives and time horizons. After all, that’s what makes a market! From our team’s perspective, this creates more buying opportunities for buy-and-hold investors who are looking for ways to add incremental yield to their portfolios, with the caveat that those investors must be able to withstand some near-term pricing volatility.
Increased Bill and CP Supply
One thing we’ve highlighted previously is the relentless increase in Treasury supply this year. Following the debt ceiling resolution in May, the market has absorbed $1.4 trillion in Treasury bills. The Treasury Department said at its latest quarterly refunding update that it will continue to rely on bills issuance at a higher proportion of its overall debt mix than historical average (currently about 22% compared to 15%-20% historically). We also observe that commercial paper (CP) outstanding, particularly from the financial sector, is modestly increasing as issuers (like Treasury) are shifting their borrowing to shorter tenor.
All of this simply means more supply — and lots of it. Basic microeconomics tells us that if we don’t get a corresponding increase in demand, the price should go down. And when it comes to the bond market, declining price means higher yields.
Of course, there are reasons to believe that market demand will ultimately adjust. For example, money market fund (MMF) assets have been growing significantly, fueling a good chunk of bill purchases in the past six months. But the increased bill supply should likewise create buying opportunities at higher yields for the opportunistic buy-and-hold investor.
Money Market Fund Dynamics
Lastly, we wanted to highlight a reliable tool in our investor tool kit — the humble MMF. Institutional government MMF yields are now 5.20%-5.25%, and year-to-date money fund assets have increased by nearly $1 trillion, now topping $6 trillion in total assets (according to Crane’s estimates).
For years investors have relied on MMFs as daily liquidity vehicles, but in the past year they’ve also been attractive because they tend to reprice their yields faster than other vehicles. Many managers have been keeping their holdings very short (in many cases, predominantly at the Fed’s daily reverse repo facility). So when the Fed raised rates quickly, these funds responded by delivering higher yields almost immediately.
Now that the Fed has been on hold for a few meetings and it appears we are past the point of rapid rate increases, we are starting to see the money fund complex mirror what our team has been doing — selectively and tactically extending the weighted average maturity of holdings. In this more stable (for now) rate environment, investors can still pick up yields by extending into bills, but because the money funds themselves are doing the same thing, investors still reap some benefit of locking in those yields for a bit longer.
We believe the Fed will be on hold for some time before it even thinks about dropping rates. The Fed has told us it needs to see convincing evidence that inflation is coming down to its target of 2% and, importantly, can be sustained at that level. Thus, for those investors who need daily liquidity in a portion of their portfolios, MMFs are still a viable option in our opinion.
There’s no doubt that the current market is replete with crosscurrents and poses plenty of challenges to corporate treasury teams. And many of our clients ask us: “What are my peers doing?” Of course, the answer differs based on each team’s cash position and objectives. But for those fortunate enough to have a war chest, they are selectively taking advantage of the volatility and market phenomena in today’s tricky market. And we think we can help!
Trading Vista: Locking in Longer (Duration)
Jason Graveley, Senior Manager, Fixed Income Trading
Sometimes bad news is good news. Market watchers certainly cheered the October economic data that showed a weaker-than-expected labor market, as nonfarm payrolls grew by only 150,000 versus a consensus estimate of 180,000. On top of that, there was a downward revision to the prior two months’ payroll numbers and a nominal tick up in the overall unemployment rate to 3.9%, according to the Commerce Department’s latest release. But are these more tepid employment numbers really the watershed moment that will alter the trajectory of monetary policy?
That remains to be seen, but the futures market has since quelled expectations of a forthcoming hike and has settled into 5.25% - 5.50% as the terminal fed funds rate. Not only that, but rate cuts are priced in for as early as the second quarter of 2024, despite clear communication from Fed officials that normalization is not currently being considered and won’t be for some time. The bias for future policy moves is currently skewed to the wait-and-see even as the tone has shifted. The Fed seems to want to allow time for the cumulative effects of the aggressive hiking cycle to play out. The messaging from Fed officials after the early-November FOMC meeting has further reinforced this. Caution seems to be the operative word with a higher likelihood that decisions will be less a reaction to immediate realized data and more about time and trends.
Treasury markets have responded accordingly, with a rally across the curve and lower yields as a result. The November quarterly refunding statement added another headwind to higher yields. Although the announcement indicated continued, gradual increases in coupon auction sizes through January, the planned sales were less than markets anticipated and sparked a bid in treasuries. We should also consider the heightened geopolitical risks and the possibility for further instability and escalation abroad — all of which will affect market yields.
If we look at our most active points along the 6-month, 12-montth and 2-year tenors, they all hit 2023 peak yields in early-to-mid October at 5.58%, 5.50% and 5.22% respectively. Since then, yields have come down considerably – although much more pronounced as you move into the longer-dated maturities on the curve. The front-end points are lower by 10, 20, and 30 basis points, respectively, since their highs. Despite the benchmark moves tighter, anecdotal dealer feedback suggests that portfolios with stable cash are still active in extending duration. The Federal Reserve’s aggressive interest-rate campaign brought back the mantra of “cash is king,” where overnight liquidity options can still return over 5%. However, as the terminal rate comes into focus and the end of the cycle materializes, more dealer commentary suggests that accounts are foregoing the peak rates in the immediate front-end and locking in longer-duration opportunities when possible. It’s certainly something worth considering at this point.
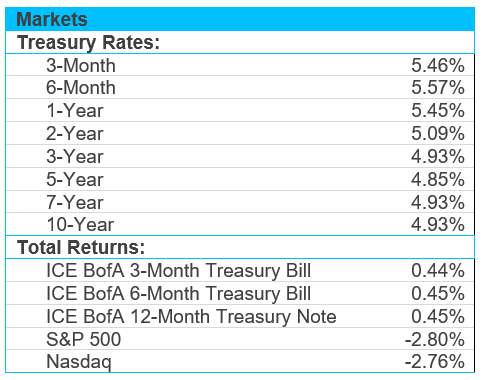
Source: Bloomberg and Silicon Valley Bank as of 10/31/2023.