The following article appeared in the Pitchbook-NVCA Venture Monitor report. Read other articles and learn more about our new partnership.
As the venture ecosystem continues to benefit from record fundraising, access to capital and valuation growth, technology companies are demonstrating traction and validating their business models at increasingly earlier stages in their fundraising life cycle. One of the key indicators of life stage and business model traction is a company’s revenue run rate, or annualized revenue.
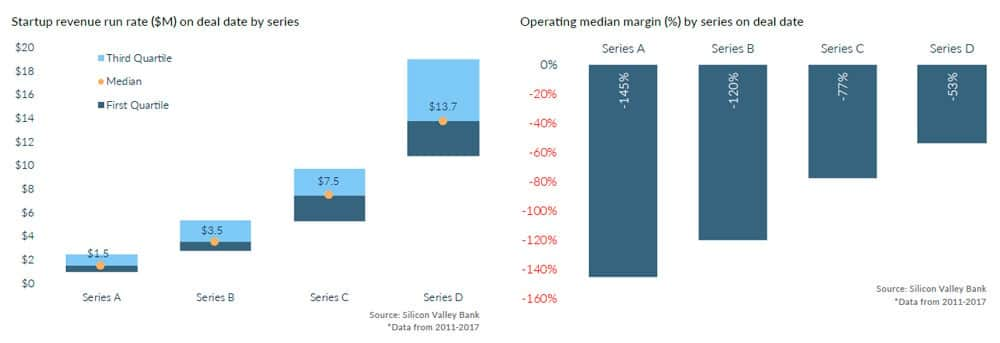
While early-stage venture-backed technology deals are rarely valued on the basis of revenue alone, many successful companies have demonstrated a multimillion dollar revenue run rate at the time of their Series A and Series B fundraising. Based on SVB analysis, US tech companies raising Series A rounds 2011-2017 showed a median revenue run rate of $1.5 million, while companies raising their Series B round showed more than double that, at $3.5 million.

At the growth stage, companies continue to scale operations and build a more predictable conversion funnel, resulting in greater revenue traction at their Series C and Series D rounds. Companies raising a Series C round showed a median revenue run rate of $7.5 million, while companies raising their Series D round showed nearly double that, at $13.7 million.
While revenue growth is a useful gauge of business model traction, especially at earlier stages, today’s venture-backed technology companies are demonstrating operating discipline, thanks in part to declining operating costs over time, and charting a path to profitability as they mature through the fundraising life cycle (Figure YY). SVB has observed that U.S. technology companies raising their Series A and Series B rounds post median operating expenses that are more than double their revenues: -145% for Series A and -120% for Series B.
As companies move to growth stage at Series C and Series D, realizing more significant traction and revenue growth, operating margins tend to improve significantly. Tech companies raising their Series C round showed a median operating margin of approximately -75%, an improvement of 45% from the Series B round, and a median operating margin of -53% at their Series D round. At this stage, successful companies continue to show operating margin improvement and revenue growth as they move to the exit stage of the J-curve and, eventually, realize their valuation through an exit event.