

- After 12 months of decreasing year-over-year (YoY) headline inflation readings, unfavorable “base effects” continue to skew the numbers to the upside.
- When extrapolating recent month-over-month (MoM) CPI figures, we are broadly encouraged that the Federal Reserve is making headway in achieving its target rate and overall price stability.
- It’s still too early to declare victory over inflation, and it’s important to understand the key components within the CPI basket, including shelter inflation, which remains uncomfortably high.
Please also be sure to read this month’s Trading Vista, Eye on Supply.
Economic Vista: The Base Case — A Closer Look at CPI
Steve Johnson, CFA, Portfolio Manager
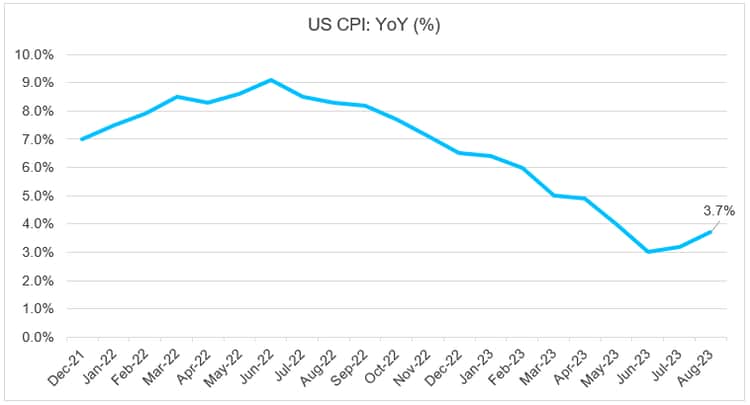
As the Fed’s rate-hike campaign and war on inflation approaches the 18-month mark, it seems that significant progress has been made since the interest rate liftoff in March 2022. After all, the US CPI was 3.7% in August of this year, a far cry from last June’s 9.1%. Although that’s a relief, it’s important to understand that last year’s spike in inflation will have ramifications on future CPI prints — and by extension, monetary policy. All this could have a material impact on future yields for the near to medium term; therefore, investors need to remain aware.
So where exactly do we stand regarding inflation, and what are the possible lasting ramifications? After peaking last June, CPI decreased for 12 straight months, taking it down to 3% in June 2023, though upticks during the summer have been a little disconcerting. More recently, we’ve seen another mini spike in oil prices, which certainly won’t be helpful for future readings. While the longer-term trend is encouraging, it’s not all daisies and sunshine.
Source: Bloomberg.
One of the underlying reasons for the higher CPI readings over the past few months lies in the nuances of base effects in YoY calculation. The CPI calculation, by definition, compares prices in one period to prices in another. The often-quoted YoY CPI, for example, compares prices in any given month against prices in that same month the year before as a ratio to determine the percentage rise in inflation. MoM calculations, on the other hand, compare prices in any given month with prices the month before.
So why should investors care about these nuances? Not only do current prices matter for inflation, the basis of comparison (i.e., prices in the past) matter as well. For this reason, when high inflation periods (e.g., December 2021 to June 2022) become the basis of any CPI calculation, inflation can appear lower given the relatively high denominator caused by past base prices. For example, the June 2022 CPI of 9.1% helped (all else equal) make the June 2023 YoY CPI print look relatively low. This lower appearance was due to the higher base prices in the denominator of the comparison. Base effects in this case are deemed “favorable” for a lower YoY CPI calculation. Conversely, as lower inflation is used for CPI comparisons, the opposite effect can occur. Lower relative denominators in the inflation ratio (all else equal) help elevate the ratio.
Bringing this concept and analysis forward helps us understand how the recent numbers may have been affected by less favorable base effects. This partially explains why the YoY CPI print increased again during the summer months. It also illustrates why we feel it’s critical to dig deeper into the CPI calculations rather than react to the headline number.
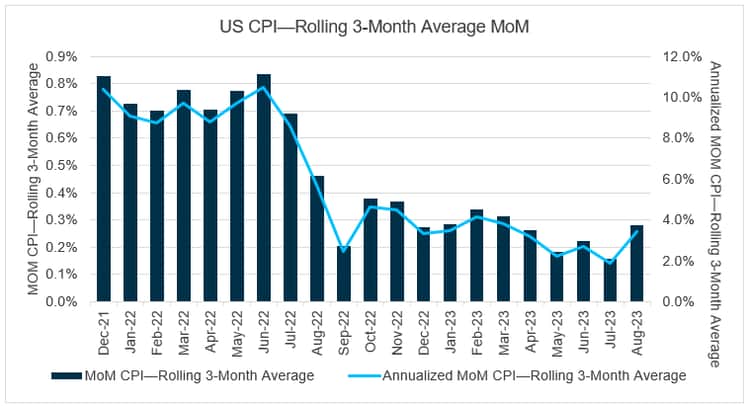
What are some other ways to look at the CPI to better gauge the Fed’s progress in its fight against inflation? If we switch to a more recent basis for price comparisons, namely MoM changes in CPI, we see some good news. Specifically, when annualizing an average of the last three MoM inflation prints, we can see the Fed appears to be taming inflation. In fact, annualizing a rolling 3-month average of MoM CPI changes through August 2023 suggests that the Fed’s 2.0% target1 could soon be within the realm of possibility2 despite an uptick in August.
Source: Bloomberg.
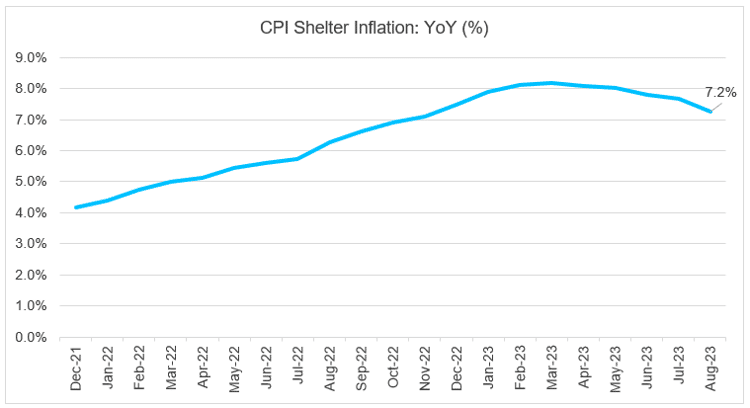
Finally, it’s not only important to look at the base effects of the inflation calculation; it’s also good to disaggregate the CPI basket to better understand the inflation outlook. Shelter inflation represents one of the important components, accounting for approximately one-third of the weight in the CPI. As shown in the next graph, shelter inflation — which largely consists of rent and owners-equivalent rent, a proxy for home prices — has not yet experienced much price disinflation on a YoY basis. This is the case despite the Fed’s 525 basis points (bps) — or 5.25 percentage points — of interest rate increases in this most recent rate-hiking cycle. Despite record-low housing affordability3 and multi-decade highs for mortgage rates,4 shelter CPI on a YoY basis remains elevated.
Source: Bloomberg.
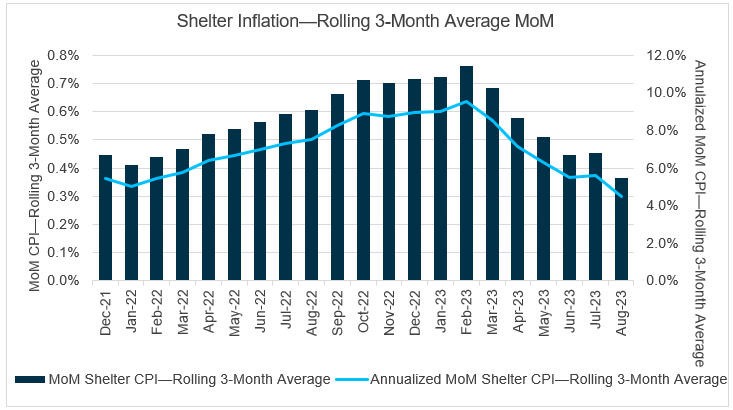
Even basing recent shelter prices against more recent comparisons shows less than ideal progress within this weighty CPI category.5 However, the trend, for now, seems to be heading in the right direction. Clearly, the Fed will hope to see further disinflationary impact in shelter prices moving forward.
Source: Bloomberg.
Ultimately, it’s a bit of a mixed bag when it comes to interpreting inflation. Clearly, the longer-term trend has been lower. But it’s probably too early for the Fed to declare victory just yet. And as we’ve just explained, investors would be wise to consider the base effect when new CPI data is released. Beyond that, it’s also critical to dive into the CPI basket to better understand what’s driving the numbers. Ultimately, inflation will shape monetary policy, and that will greatly impact yields and all aspects of the bond market. We’ll be watching and adjusting portfolios as needed in this dynamic environment.
Trading Vista: Eye on Supply
Jason Graveley, Senior Manager, Fixed Income Trading
Keep your eye on the supply. That just might be the bond market’s new mantra. With recent economic data helping stabilize rate expectations, the focus has shifted from the fed funds target to an emerging supply story in the Treasury market. The debt ceiling impasse that garnered many headlines through the first half of 2022 left the Treasury’s General Account (TGA) uncomfortably low. The TGA is the main cash account of the US Treasury and is used for disbursements and tax collection deposits. It’s also where funds are deposited from Treasury debt sales. Typically, the US Treasury targets a balance of $500 billion-$600 billion in this account, but the balance sunk below $50 billion at the end of May.
To rebuild the account balance and continue to finance the government, the US Treasury immediately began to increase issuance after the June debt ceiling resolution. This looks to continue through the end of the year. In the most recent announcement on marketable borrowing estimates, the Treasury has a $650 billion and $750 billion TGA target balance for the end of the third and fourth quarters, respectively. To achieve these balances, the US Treasury has ramped up its auction sizes to new records, and total debt outstanding in bills has grown by more than $1 trillion from May 31 to August 31.
Of course, this rapid rebuilding of the TGA account has implications for liquidity. After all, a jolt in supply without a concurrent rise in demand would cause yields to jump across the bill curve. However, if we focus on the short end where most of the new issuance has been (and will likely continue to be) concentrated, the three- and six-month bills have only risen by a modest 5 bps. This has been attributed to a common theme: There is just too much cash waiting in the front end of the curve.
For evidence, consider the robust year-to-date (YTD) flows into Treasury and government money market funds (MMFs). According to Crane, which tracks money markets, mutual funds, and cash investments, Treasury and MMFs have enjoyed inflows in excess of $600 billion to date this year. There are a variety of factors contributing to burgeoning assets under management (AUM) this year, including the perceived safety amid a spike in regional bank volatility as well as the notion that investors have moved to capture the large yield pickup between MMFs and bank deposit rates.
As MMF balances have swelled, so too has the amount at the Fed’s overnight reverse repurchase facility (RRP). The RRP has been a natural outlet for MMFs to invest in, simply because it yielded higher than the very front end of the Treasury curve and provided overnight liquidity. Because of this, it has not been uncommon to see MMFs allocate 70% or more to the Fed’s RRP. But things could be changing. As the Treasury curve cheapens and supply comes to market, the abundance of cash in the Fed’s RRP has allowed MMFs to toggle between RRP and Treasuries, depending on the market’s rate projections. With growing expectation for a more dovish monetary policy, Treasuries have gained favor. Coincidentally, RRP balances have declined from $2 trillion as of the end of June to just over $1.5 trillion at the time of this writing. In fact, this marks the lowest balance at the Fed’s RRP since March of 2022. Nevertheless, we are committed to watching the supply dynamics closely.
So what’s the key takeaway for investors as we look toward the fourth quarter? Analysts estimate approximately $430 billion of net T-bill issuance before year-end. This could continue to impact short-term yields, and thus the ultimate impact on money market spreads remains a hot topic for money managers. However, we believe there is still ample cash to digest the increase in issuance, and this should help keep a ceiling on front-end Treasury yields.
Source: Bloomberg and Silicon Valley Bank as of 8/31/2023.