
- After a sharp climb higher over the past 16 months, we are likely at, or hovering near, peak fed funds rates for this cycle.
- The market’s consensus opinion of interest rate policy (which manifests in the yield curve) is often at odds with FOMC’s guidance; however, looking at history can help inform investment decisions.
- In the current uncertain environment, being nimble lets us take advantage of mispricing in the near term, while allowing us to stay defensive, manage risks and maintain ample liquidity.
This month’s main article, Peeking Past this Peak, anticipates the end of the Fed’s historic rate hiking cycle, but considers different scenarios that may materialize if economic predictions do not hold true. Given the uncertainty that remains in the market, it is important to act tactically, while staying defensive and continuing to provide ample liquidity.
Please also be sure to read this month’s Trading Vista, Debate the rate.
Economic Vista: Peeking past this peak
It was an impressive climb higher. Over the past 16 months, the Federal Reserve went on a historic rate-hiking cycle, significantly tightening monetary conditions in an effort to combat elevated (and sticky) inflation. The fed funds rate went from zero to a target range of 5.25% to 5.50% after the July FOMC meeting. All these rate hikes had significant ramifications for both bond, stock markets and different sectors of the economy, as we all know by now.
But rates don’t move higher forever—and certainly not at such a historic pace. So while most market watchers agree that we must be hovering near peak rates, investors want to know what comes next. Will the Fed hike rates a few more times, stand pat for a period, or pivot and begin cutting rates if the economy backslides? An argument can be made for each of these scenarios, and this complicates investment strategy for investors. With that in mind, let’s take a peek as to what might come after peak rates.
Embracing the uncertainty
Many try to predict the market, but few succeed. But that doesn’t stop the pundits from trying. Investors are bombarded with opinions from an array of players—including Wall Street banks, asset managers, and even the FOMC’s own forecasts—on the eventual path of the fed funds rate. These views get boiled down into the market-derived yield curve, which reflects the views of investors in aggregate after they digest all the available information. Even though opinions vary, this consensus is important. And with the help of a little math, we can then determine the implied path of the fed funds rate. We also must remember that the Fed only controls the overnight fed funds rate, and it is the market participants who actually determine the shape and level of yields along the curve.
Forecasts are a vital input into the investment process, and as we have learned over the past 18 to 24 months, they can often be off target. Some of the most watched forecasts come from the FOMC members when they update their quarterly economic forecasts in the Summary of Economic Projections (SEP). The SEP provides near-term and longer-term forecasts for the most important economic indicators and fed funds rate. These forecasts and other communications from FOMC members are closely watched, debated, and considered by investors. Many will compare the FOMC’s forecast of the fed funds rate, the market’s implied path and their own view when determining investment strategy.
 Source: Bloomberg, Data as of 7/31/2023
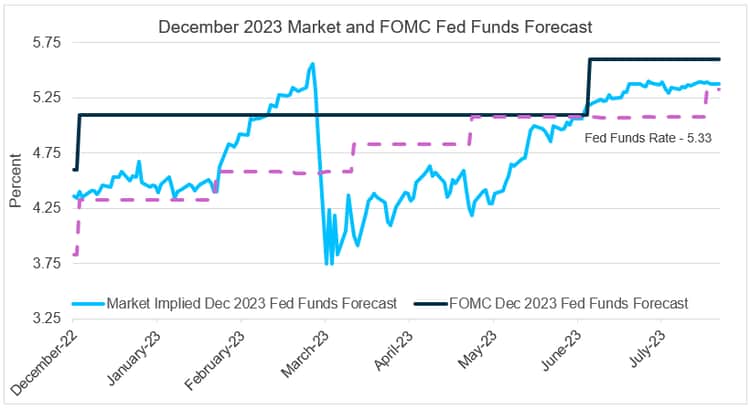
As we entered 2023, the FOMC was forecasting an additional three 25-bps fed funds hikes this year. Meanwhile, the market was more hopeful that the hikes were over and that the fed funds rate would end the year where it began. While the yield curve was not pricing in additional fed funds hikes, the FOMC members were resolute in their commitment to additional hikes, and the members were fairly vocal in their comments. This provided the astute investor an opportunity to express an opinion via an investment strategy. The choice was to accept the market assumption of no more rate increases or position more towards the FOMC forecasts. As the year progressed, the market quickly moved towards and exceeded the FOMC’s forecast.
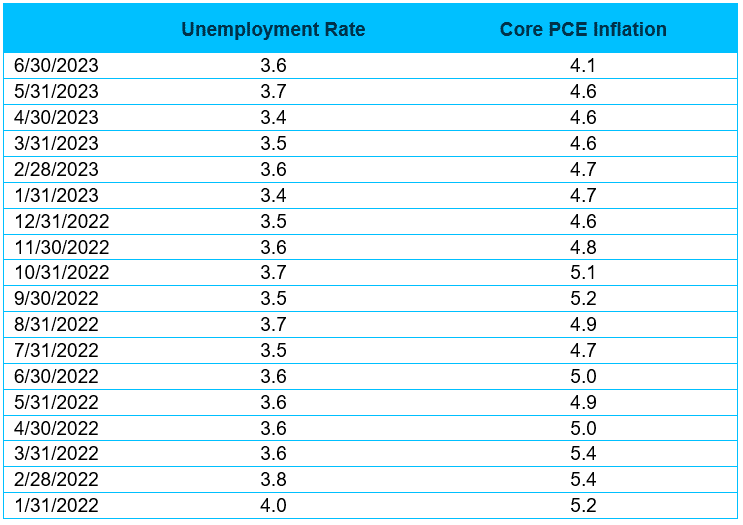
Again, investors were presented with another opportunity to express their view. Towards mid-year, the market and the FOMC were at odds again. The Fed had completed three 25-bps rate increases, but the market was now less optimistic on the economy and was forecasting those increases to be reversed by a series of rate cuts by year end. Thus, market expectations were forecasting a sharp change in monetary policy, which was quite different than the communicated stance from the FOMC. Economic data at that time was not pointing to a dramatic shift in economic conditions to warrant such a change. In fact, the employment situation has remained remarkably strong in the face of all the fed funds increases of the past year-and-a-half, and Core PCE Inflation has tracked well above the FOMC’s target of 2%. Perhaps that’s why we saw the FOMC resume raising rates at the July meeting.
 Source: Bloomberg, Data as of 7/31/2023
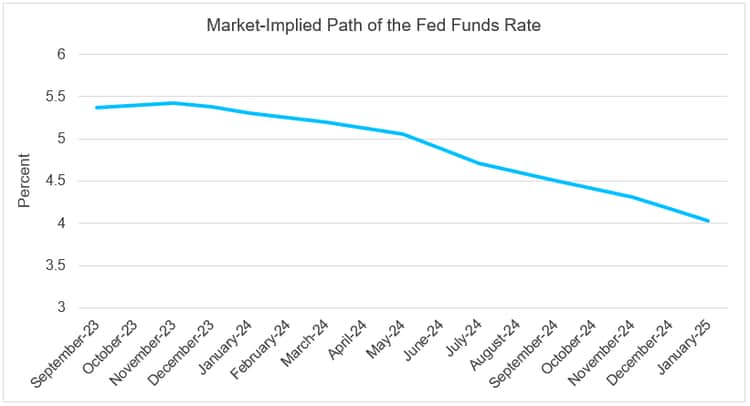
As the market enters the last third of 2023 and the likely peak of the fed funds rate, the focus will turn to how long rates will remain elevated, and if rate cuts might actually begin soon. In fact, the market now expects the Fed to start cutting the fed funds rate in the second quarter of 2024 (a total of five times in 25-bp increments before the end of 2024).
When the last SEP was released in June, the median estimate of the fed funds rate at the end of 2024 was revised up slightly to 4.6%. While the FOMC’s forecast may continue to be a moving target, the market’s forecast will likely fluctuate depending on the incoming economic data. For now, however, the market is already signaling a sharp shift in policy. It is up to investors to weigh the likelihood of this path materializing.
 Source: Bloomberg, Data as of 7/31/2023
Learning By Looking Back
Sometimes investors can look back at history to gauge how long the Fed may be able to hold the fed funds rate at peak levels before starting a new rate-cutting cycle. One could argue this cycle is different from others and may not resemble similar economic conditions. Looking back to 2000, the market has experienced three different fed funds cutting cycles where the Fed was able to hold the fed funds rate at their elevated level for between seven and 15 months (with an average of 10 months). Each of these cycles occurred for different reasons, so it may be difficult to extrapolate precisely for today’s market. That said, the market is currently forecasting the first cut beginning nine months after the final rate hike in about nine months. That’s right in the target zone of what history suggests.
So what’s the end takeaway for investors at this juncture? It appears that the market has been quick to price in a pivot in monetary policy based on limited data. However, members of the FOMC have been preaching patience and a commitment to bringing Core PCE inflation back to its 2% target. Future employment and inflation data will no doubt play a key role in determining the ultimate moves of the FOMC. However, given this high level of uncertainty, we feel that positioning portfolios in a nimble fashion may be the most important action item. This should allow us to take advantage of any potential mispricing in the market to capture incremental yield, while staying defensive and continuing to provide ample liquidity.
Trading Vista: Debate the rate
Jason Graveley, Senior Manager, Fixed Income Trading
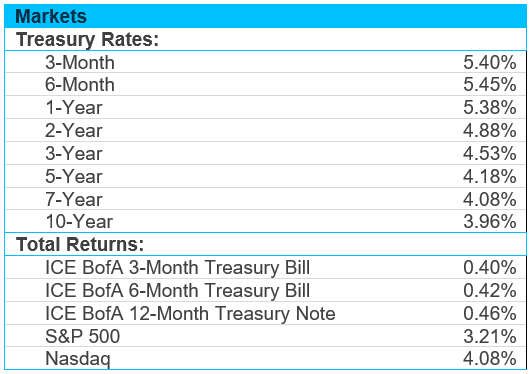
Questions abound, and market consensus is declining. Investors remain unsure on the forward path for monetary policy, and there is much debate as to where rates will go next. The market is certainly anticipating rate cuts in 2024, with a forward implied rate at approximately 4.50% next summer, compared to an effective fed funds rate of 5.33% at the time of this writing. But what about the near term? Investors are also wondering whether this is this is the top of the hiking cycle, or if there is room for rates to run even higher in the short-term.
Rates today are at their highest level in more than 20 years, but we don’t know for certain if we we’ve hit the peak. Federal Reserve Chairman Jerome Powell has been noncommittal about the Fed’s next move and instead has been stressing the need to remain flexible based to the economic data. This echoes the same message we’ve heard from other Fed officials, and now all eyes will be on future employment and inflation reports. The Fed and the market will get to digest a fresh back of numbers before the September FOMC meeting, and that could result in a bout of volatility if the data abruptly shifts sentiment.
For the moment, however, the recent economic data has been encouraging. Popular measures of inflation confirm that it is well off the peak levels of last summer, while job creation and unemployment trends have been right in line with what Federal Reserve officials have been hoping for.
What has this meant for financial markets? Yields on front-end Treasuries have been trending lower since early July and are down more than 20 basis points month-over-month. However, the market caught a large bid after the jobs report number was published. Multiple headlines referred to it as a “goldilocks” report—not too hot and not too cold. In other words, the data showed a gradual cooling economy, which would likely keep the Federal Reserve on the sideline with regard to more rate hikes, while bolstering the likelihood of a soft landing. The economy added 187,000 jobs in July compared to the monthly average of over 400,000 last year, which suggests that the cumulative impact of all the rate hikes are finally having the Fed’s desired effect.
As investors temper their rate expectations, the market has seen a rotation from liquidity into term investments. Government money market funds themselves have reduced their overnight exposure to the Fed’s Reverse repo facility, where balances bottomed at $1.7 trillion in July. This is well below the peak of more than $2.5 trillion at the end of 2022. This rotation has been occurring throughout the year, although weighted average maturities (WAMs) peaked after the FOMC decision to hold rates unchanged in May even as they remain elevated compared to the start of the year. Since then, money fund composition has oscillated with the market. As the U.S. Treasury has reignited issuance after the debt ceiling resolution, money market funds have pivoted into Treasury bills. At the same time money market funds have been reducing their reliance on the overnight component (some by more than 20%).
Although nothing is certain, it appears that we may be gliding into the end of the rate hike cycle and (hopefully) a soft landing for the economy. However, this is shifting the landscape for yield investors and placing an additional emphasis on duration management. We’ll be watching and aim to position portfolios opportunistically.
Source: https://www.wsj.com/articles/jobs-report-july-today-unemployment-economy-d9af32f3
 Sources: Bloomberg and Silicon Valley Bank as of 7/31/2023.