- Many investors look at CPI as the key measure of inflation, but the PCE index is what the Fed watches most closely.
- An average inflation target of 2% has not always existed or been widely publicized by the Fed, but since 2012 has been codified as the level most consistent with the Fed’s dual mandate.
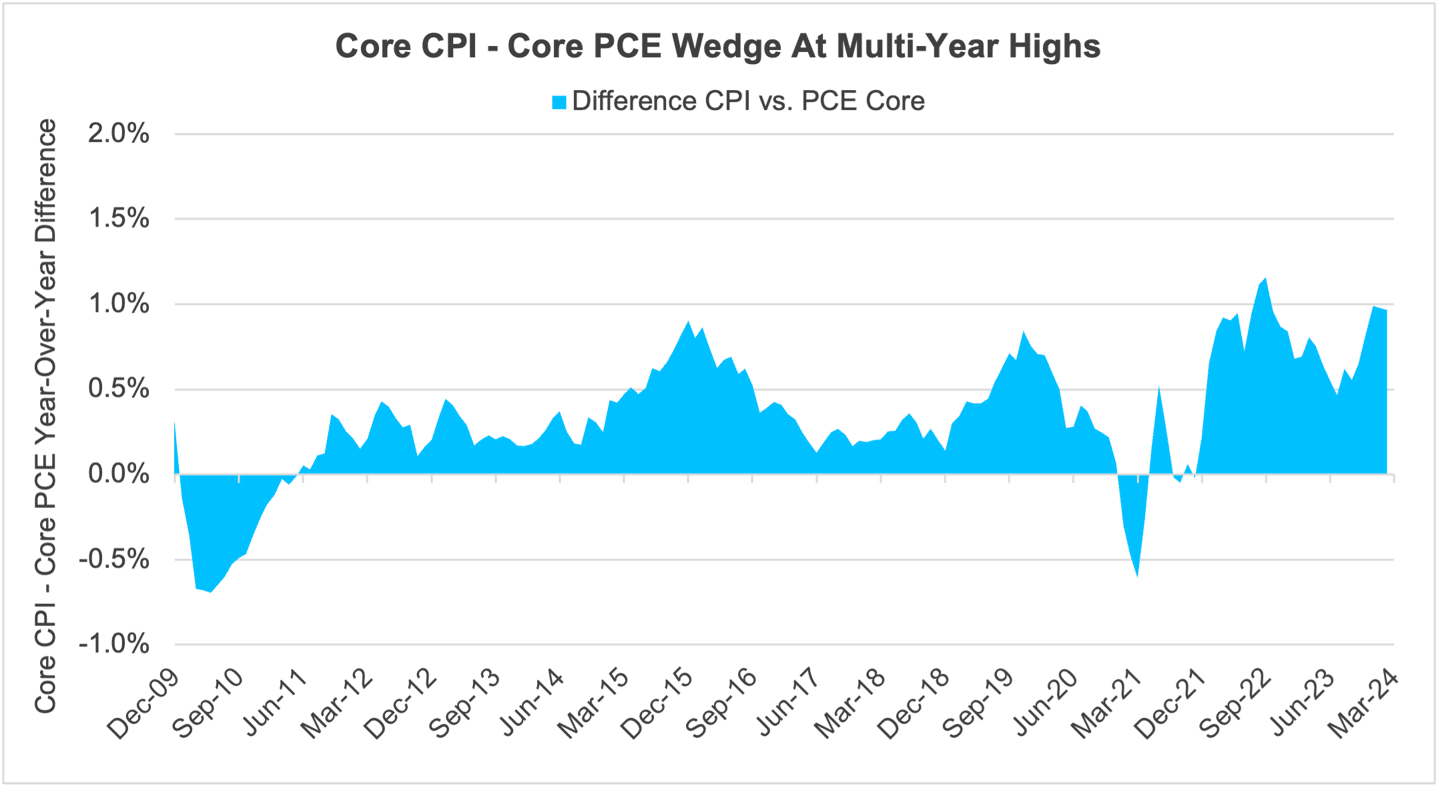
- The Fed has made good progress in bringing down inflation, yet the “wedge” between core PCE and core CPI sits at multi-year highs.
Economic vista: To PCE or not to PCE
Steve Johnson, CFA, Portfolio Manager
Most investors—and media outlets too—tend to focus on the popular Consumer Price Index (CPI) when discussing inflation. Yet the Federal Reserve clearly favors a different measure of inflation, the Personal Consumption Expenditure (PCE) Price Index, when it comes to making monetary policy decisions. What are the differences between these two metrics, and how might the Fed be viewing the overall inflation picture? Let’s learn more so we, too, can think like the Fed.
Over the past few years, the single overriding story that has shaped financial markets and investor sentiment has been the rate of inflation, and by proxy its impact on the Fed’s decision to raise or cut interest rates. On the ground, the consumer has felt the inflation pressure at the grocery store, at the gas pump, and in numerous tangible ways. Inflation has been discussed at cocktail parties and will no doubt be a political issue during campaign season. It’s a hot topic.
The best-known gauge of inflation is the CPI, a basket of goods and services used to measure the change in prices paid by consumers. The Bureau of Labor Statistics (BLS) measures and releases CPI data monthly, and this affects the lives of millions of Americans through things like adjustments to social security payments or even changes in Federal tax brackets to avoid inflation-induced tax increases.1
But there’s another, lesser-known inflation yardstick published by the Bureau of Economic Analysis (BEA), the PCE, which covers a slightly different basket of goods and services. Back in 2000, the Fed announced that it was switching from favoring CPI to PCE as its main inflation yardstick.2 Several reasons underlie this change in preference. First, the category weights of goods and services within the PCE basket are updated monthly, helping account for consumers’ substitution away from some goods and services toward others.3 CPI weights, on the other hand, are only updated annually by the BLS. Secondly, the PCE includes a broader range of goods and services versus the CPI, making it a more comprehensive measure of inflation. Lastly, the historical PCE data can be revised for more than just seasonal factors.4 All these differences motivated the Fed’s preference for using PCE to inform policy decisions, although they still consider a broad range of data including the CPI.
Still Targeting 2%?
What, exactly, is an acceptable rate of inflation for the Fed? The short answer is that the Fed would like to see headline PCE (including food and energy) average 2%. A little inflation is widely considered good. Too much or too little inflation is bad. It’s a tricky balance, but they’re aiming for that 2% sweet spot.
Interestingly, prior to 2000, mentions of any specific inflation target by Fed members were extremely rare, leaving the public with only speculation and hindsight as to the Fed’s specific goal for price stability within the U.S. economy. From 2000 through the Great Financial Crisis, consensus seemed to form around an inflation target of 1.5%, and disclosure by Fed members at Federal Open Market Committee (FOMC) meetings increased in frequency. Still, no official target (or agreement on the benefit of a public target) existed.5 Finally, in January 2012, the Fed publicly released an official 2% inflation target with the rationale that 2% was most consistent with the Fed’s dual mandate of maximum employment and price stability. At 2%, the Fed argued, households and businesses can reasonably expect inflation to remain low and stable, enabling good decision-making around saving, borrowing, and investment. Further, 2% avoids inflation being too low, which could result in a cycle of ever-lower inflation and inflation expectations by households and businesses. Lastly, 2% for inflation was thought to provide the FOMC with adequate room to cut policy rates in an economic downturn.6 The Fed reiterates its inflation target, which currently remains at 2%, with each Summary of Economic Projections, released four times a year at FOMC meetings:

Are We There Yet?
By all accounts, it would appear the Fed is nearing its inflationary objective. After all, year-over-year headline PCE came in at 2.5% in February 2024. Headline CPI, on the other hand came in at 3.2%. Looking at the core measures (excluding volatile food and energy categories), the disparity increases even further. In February, core PCE came in at 2.8% versus core CPI of 3.8%. Recent history shows us this “wedge” between the two core inflation measures is particularly pronounced:

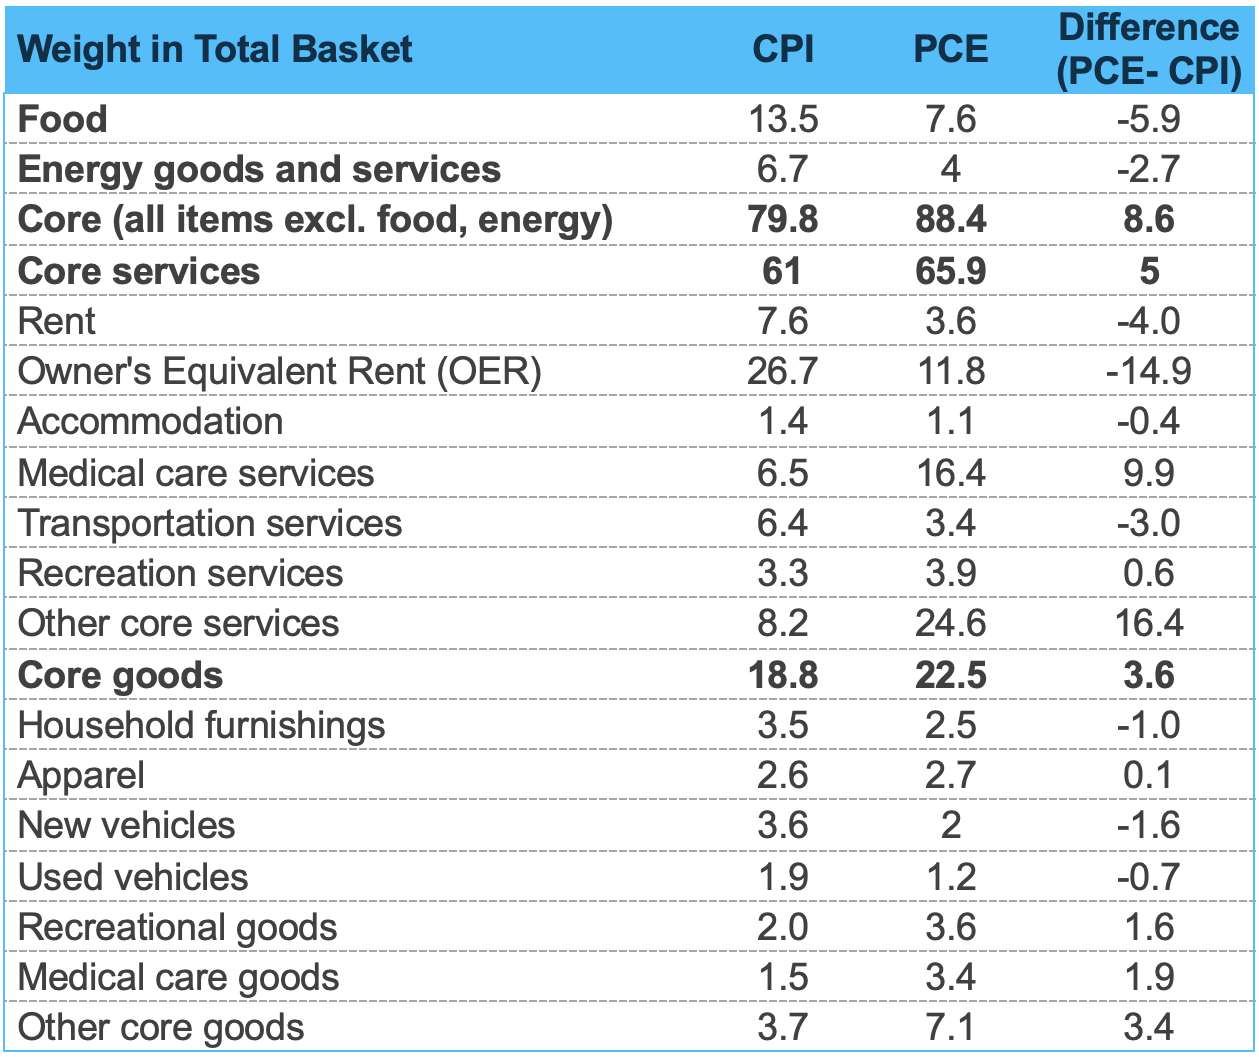
Research points us to several well-discussed explanations for this gap, including differences in formulas, as well as the scope and weights between CPI and PCE7. The CPI formula holds weights fixed, while PCE weights can float with substitutions into or away from comparable items. Another factor is the “scope effect” which refers to the differing breadth of goods and services each index attempts to include. For example, CPI includes out-of-pocket consumer expenses within the urban population, while PCE considers both urban and rural populations and includes expenditures purchased on behalf of consumers, even third parties (e.g., healthcare insurance providers, purchasing prescription drugs on behalf of patients). Differing scope impacts weight disparities simply because PCE includes some expenditures that the CPI does not. Lastly, the “weight effect” is the result of differences in sourcing for the expenditure data used to weight the price changes in each index. The PCE Index takes data for expenditures from the BEA’s National Income and Product Accounts tables and measures what businesses sell to consumers. In contrast, CPI sources expenditures from the BLS’ Consumer Expenditure Survey of what consumers purchase from businesses. This often results in large differences between certain category weights in the CPI and PCE. For example, housing (rent and OER) combine for over 34% weight in the CPI versus just over 15% in the PCE. At the same time, medical care services are more than double the weight (16.4% versus 6.5%) in PCE versus CPI.8

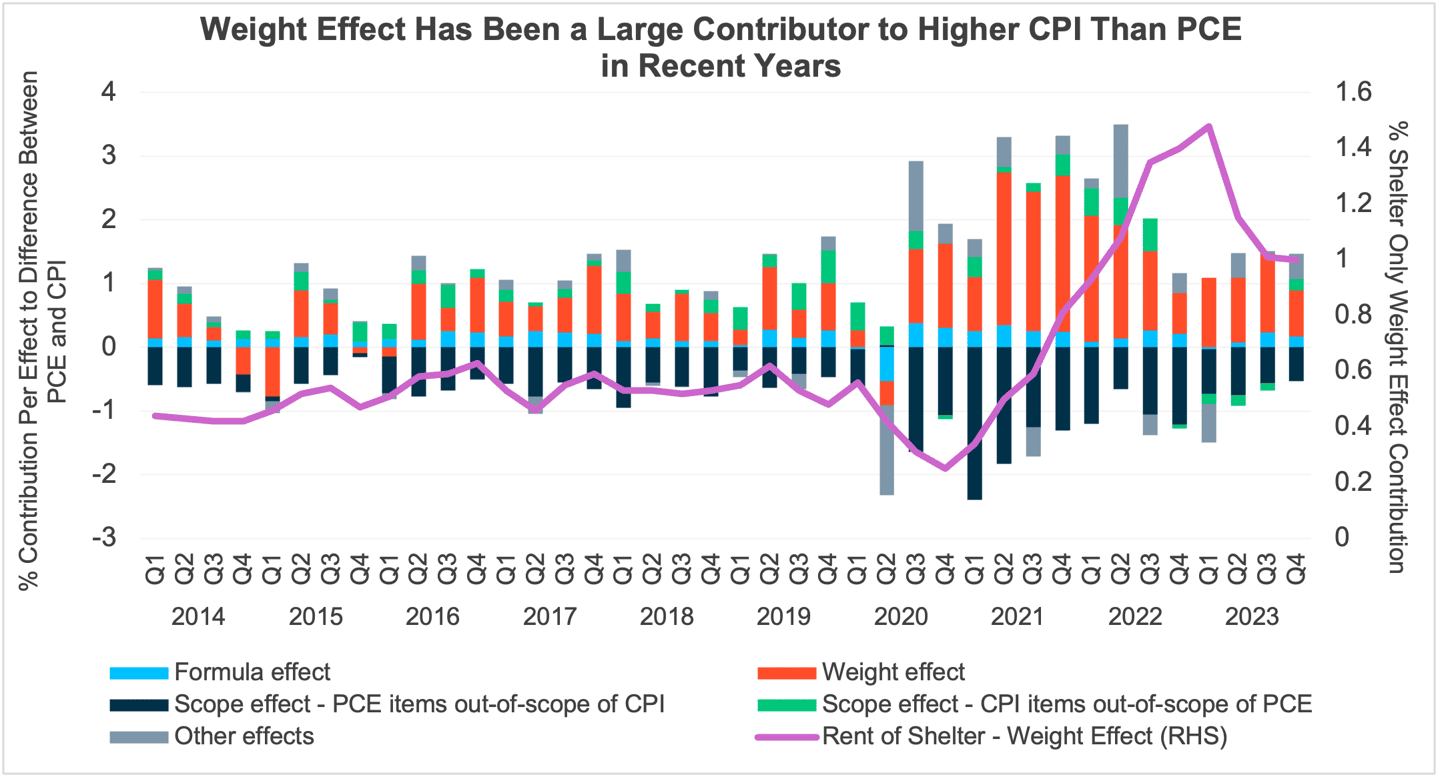
Recent history shows that the overall weight effect has had a pronounced impact on the “wedge” between CPI and PCE. A reconciliation of the gap between PCE and CPI levels for the last 10 years shows the outsized impact of the weight effect clearly. In particular, the weight effect of shelter on its own has contributed more than one percent to the disparity between the two inflation measures since the second quarter of 2022. This makes sense given large differences in weighting for housing within the two inflation measures.

Data-Dependent
There’s no denying that inflation has been a central story for all consumers, investors, and the Federal Reserve for several years now. This is unlikely to change in the near term, and thus we remain quite focused as the Fed’s moves will ultimately impact bond yields. As we’ve outlined here, there are many statistical nuances and historical changes worth considering when analyzing inflation, but it’s clear that the Fed today generally prefers the more flexible and robust characteristics of the PCE formula and targets an average of 2% inflation for price stability. Although markets are still anticipating rate cuts this year, the timing and extent of any such moves will be data dependent. Meanwhile, we’ll be watching, and we’ll do our best to think like the Fed.
Trading vista: The song remains the same
Jason Graveley, Senior Manager, Fixed Income Trading
Same story, different month. We previously highlighted how the market had been consistently ahead of the Federal Reserve regarding expectations for rate cuts and “normalized” monetary policy. And then, the employment report surprised to the upside and prompted the market to remove one rate cut from its forecasts. March came and went with no rate cuts.
Well, déjà vu! Fast forward from February to April and a similar story seems to be playing out. Strong employment data and higher-than-comfortable inflation readings are shifting rate-cut expectations, or at least deferring them, and the bond market has taken notice. The two-year Treasury yield—the point considered the most sensitive to changes in monetary policy—just hit its high point of 2024 after nonfarm payrolls and inflation data once again exceeded expectations. The market consensus has shifted as many investors are now looking to September for the first potential rate cut, pushing forecasts further into the calendar year while simultaneously lowering the total number of cuts with each passing month. Consensus has coalesced around two 0.25-basis point rate cuts for 2024, down from (the overly optimistic) six to start the year, and a far cry from some investment firm’s forecasts that went as high as double digit rate cuts and even called for a likely recession.
If anything, this string of economic data only reinforces the “wait-and-see” approach of the Federal Reserve. As the Fed has been messaging, rates are likely to remain higher-for-longer, which presents a more sustained buying opportunity for investors. And investors are taking notice. One area where demand has picked up has been in various prime and bond fund complexes. It is estimated that year-to-date inflows have already surpassed the totals of each of the previous four years in bond funds, according to research published by TD Bank. Prime funds are also enjoying solid year-to-date growth, according to Crane’s data. Not surprisingly, credit spreads have moved in kind as more investors have come into the market. The Bloomberg US Corporate 1-3 Year index recently closed at its tightest spread since 2022, as yield-hungry investors look to lock-in elevated rates.
We realize that the primary market can sometimes serve as an outlet to find yield concessions; however, technicals there have been affecting spreads as well. Despite year-to-date supply that is up over 39% in investment grade issuance, new issue concessions have dropped by half in the same period. Issuers are now enjoying material pricing leverage, where oversubscription in books remains closer to four times the available supply. Despite the overall tightening in credit spreads, all-in book yields remain attractive and well above 5% for most securities in the two-year space. Although the window of higher rates has been extended and spreads remain tight, these yields will not last here forever. Most investors recognize that reality and are acting accordingly before the market changes its tune.

1 Source: Bureau of Labor Statistics (BLS)
2 Source: Federal Reserve Monetary Policy Report to the Congress, on Feb. 17, 2000<
3 Source: Federal Reserve Bank of St. Louis
4 Source: Federal Reserve Bank of St. Louis
5 Source: Federal Reserve Bank of San Francisco
6 Source: Federal Reserve
7 Source: BLS
8 Source: Barclays as of February 2024


