

- Evaluating an investment manager and judging strategy performance requires more than comparing absolute returns. A good benchmark is paramount.
- Studying various benchmarks over time can help investors dial in an actionable investment strategy with the right risk and return tolerances for their circumstances.
- Although there are many benchmarks from which to choose, it’s important to select one that corresponds to the desired risk profile and investment objectives of each strategy.
Economic Vista: In Benchmarks We Trust
Jeff Probst, CFA, Portfolio Manager
How should you judge the performance of your fixed income portfolio? The answer to that is complex, and it goes much deeper than glancing at last year’s absolute returns. Attaching a benchmark to a strategy can prove to be invaluable by framing any discussion about performance in the context of risk. While the presence of a benchmark may be helpful, understanding the intricacies of that benchmark, as well as how it relates to the characteristics of your specific investment strategy, will provide clarity into the true performance of a fixed income portfolio.
What is a benchmark?
A benchmark is an unmanaged subset of securities that is defined and administered by preset rules that determine the composition of securities. The rules are defined and managed by an index provider, most commonly ICE Bank of America or Bloomberg Barclays for fixed income markets. There are over 6,000 unique indices (any of which can be used as a benchmark) within the ICE family of fixed income indices, each differing by exposures to maturity, country, currency, security type and credit rating. At the end of each day, index providers use complex procedures to determine the market price of each security, which ultimately leads to various performance figures. In many cases, those same individual security prices (or similar prices from a different pricing provider) will flow into an investment manager’s portfolio. This allows investors to see their portfolio in the context of “peer” performance. At the end of each month, each index is reconstituted based on the previously defined set of rules. Securities that no longer fit the rules are removed and new securities may be added.
Below is a short excerpt of the rules pertaining to an ICE Bank of America index that has government and corporate securities with maturities from 1-3 years. The index presented is a subset of a much broader index that has its own set of rules as well.
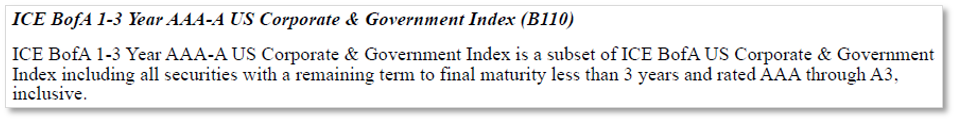
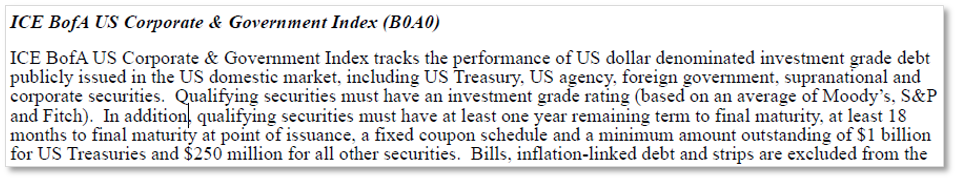
Source: ICE Bank of America
How can a benchmark enhance an investment program?
Benchmarks provide a starting point to frame strategy, discuss and define risk tolerance, and ultimately judge portfolio performance. Most indices have very long track records of data that span many economic and monetary cycles. This allows investors to compare different risk exposures with historical returns, which allows them to think about what type of strategy/benchmark works best for their particular investment objectives.
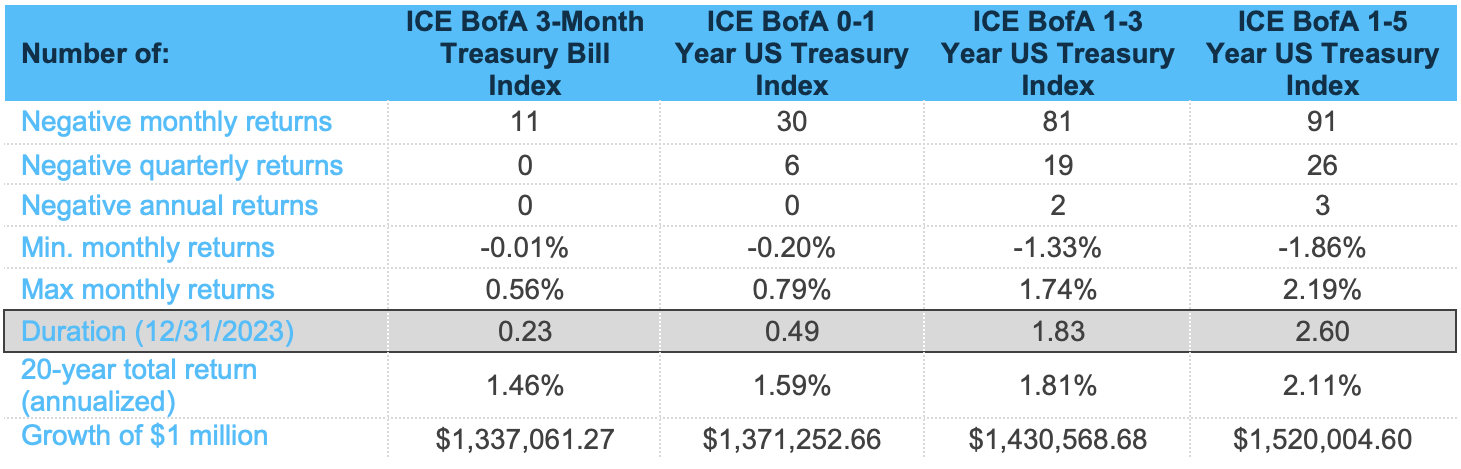
One of the key benefits of having such a robust set of historical data is being able to isolate specific risk metrics by comparing similar indices while varying single risk metrics. By doing this we can add context to the risk/reward trade-off. In the tables below, we first explore how duration—which is a measure of interest rate sensitivity—can affect risk and return over a twenty-year period. We can isolate duration by using Treasury benchmarks, since they are not influenced by credit spread or currency movements.
As duration increases, so does the frequency of negative monthly/quarterly/annual returns, as well as monthly return volatility. That’s probably not surprising, given how we all remember 2022 and the Fed’s aggressive rate-hike campaign. However, investors might be surprised to see that as duration increases, so has the annual total return over a twenty-year period.
Using the same methodology, we can also analyze credit risk in the benchmarks by looking at similarly constructed indices, but with only investment-grade corporate bonds (rated “AAA” through “BBB-“) issued in the United States. Interestingly, the frequency of negative monthly/quarterly/annual returns largely decreased, but the magnitudes of minimum and maximum monthly returns increased. Also, each of the twenty-year annual returns are approximately 1.00% higher than their similar Treasury benchmark. All this data can be used to help dial in an appropriate fixed income strategy.
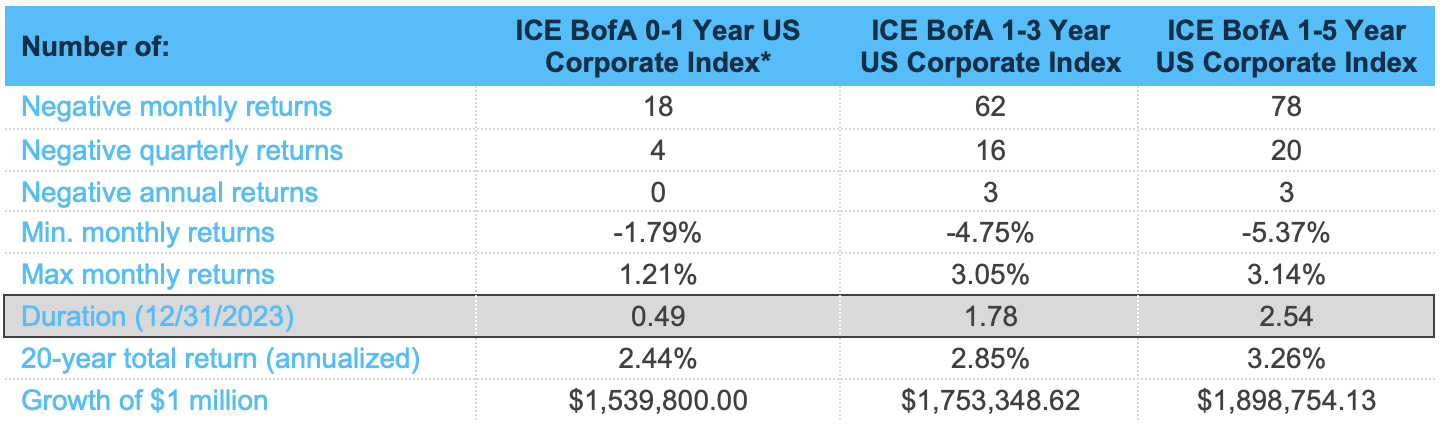
Source: ICE BAML as of 12/31/2023. *ICE BofA 0-1 Year US Corporate Index data started 01/31/2006.
How to choose the best benchmark?
We understand that choosing a benchmark can be a difficult task. It’s an important decision, but ultimately, investors need to determine and define investment objectives, risk tolerance, and how the investment strategy may evolve over time. Studying various benchmarks may assist in developing an actionable investment strategy as investors can judge their risk and return tolerances over a certain time horizon. More commonly, we try to match a benchmark to a unique investment strategy based on a client’s investment policy, risk tolerance and, importantly, liquidity needs. Benchmark data may be used to supplement and support conversations between the portfolio manager and client about performance relative to the chosen benchmark.
Although there are scores of benchmarks from which to choose, investors must also be aware that it may be impossible to find a perfect benchmark, as strategy characteristics tend to fluctuate around funding cycles, one-off liquidity needs or market conditions. A benchmark might be a “decent” fit at the implementation of strategy, but it may not be representative at another time. Remember, a benchmark is a good starting point, but strategy deviations can occur intentionally or based on changing cash and liquidity needs.
Since a benchmark operates under a strict set of rules, it does not have the freedom to adjust based on market conditions. An investment manager may, however, deviate the strategy from benchmark characteristics when they feel those adjustments may provide better returns than the agreed upon benchmark. For example, going into 2022, an investment manager could have maintained a shorter strategy duration in anticipation of rapid fed funds rate increases. This may have allowed the manager to outperform its benchmark as the index had to keep “buying” all securities that fit their rules in a rising interest rate environment. When an investment manager deviates from the benchmark, it creates the opportunity for outperformance and, conversely, underperformance.
While an investment manager may mirror the characteristics of an index, the underlying strategy will likely have a different composition of securities than the benchmark. Sometimes an investment manager cannot source the specific bonds in an index, or they may not have funds to purchase new securities because of client withdrawals. These factors may create performance and strategy deviations from the benchmark. It is also worth mentioning that the risk and allocation characteristics of a benchmark can sometimes change even as the preordained rules that govern the index stay the same. For example, the duration profile of an index can drift, sometimes substantially, depending on certain market dynamics. As a result, investors may need to revisit their chosen benchmarks periodically to ensure that they are using the best barometer for their situation.
In the end, a benchmark can play a vital role in shaping an investment strategy, and then judging performance within the appropriate framework and context. Benchmark discussions also can be a great way to foster communication between the investment manager, investor and oversight bodies. Don’t just set it and forget it. Use your benchmark to keep your investment strategy on track!
Credit Vista: Bye Bye BTFP
Michael Duranceau, Credit Analyst
So long, BTFP. The Bank Term Funding Program, or BTFP, was the Federal Reserve’s emergency bank lending program that was established in response to the U.S. regional banking turmoil a year ago. As of March 11, 2024, this funding lifeline expired, and the program has stopped making new loans. Does this mean that the banking sector has fully stabilized, and the Fed sees no need for the continuation of emergency lending measures? Or are there additional risks on the horizon? Let’s take a deeper dive into why the program was implemented, how impactful it was, and what it says about the current state of the U.S. banking sector.
History of the BTFP
In response to the U.S. banking turmoil in March 2023, the Federal Reserve instituted an emergency bank lending program, the Bank Term Funding Program. The BTFP allowed banks in need of additional liquidity to pledge eligible high-quality collateral (such as U.S. Treasuries, agency debt, and mortgage-backed securities) in exchange for 100% of the par value of that collateral in the form of a loan of up to one year. This provided an alternative for pressured banks to selling off securities at a loss in order to access liquidity to cover the decreased availability of deposit funding. In essence, the BTFP (along with the Fed’s other lending programs) was a replacement for the stable funding provided by depositors prior to the stress in the banking system.
Various liquidity safety nets for banks have been in place for some time, including the Federal Reserve’s Discount Window, often known as the lender of last resort. However, there are several differences when comparing the Discount Window to the BTFP including: rate, length of loan advances, eligible collateral, and valuation of that collateral. One of the key advantages of the program was that the BTFP based its collateral valuation on par value, rather than on market value (as is the case with the Discount Window). This was an important differentiator as many banks had large unrealized losses on their bond portfolios due to the rapid increase in interest rates over the past two years. Under the Discount Window, borrowings against these underwater securities would have been calculated using market value rather than par value, which ultimately may not have generated as much liquidity as banks needed or desired.
While the Fed’s Discount Window is an important ongoing part of the overall banking industry’s safety net and has historically seen high levels of borrowing during times of stress, the BTFP provided an emergency funding alternative to banks who otherwise would likely not have been able to secure adequate liquidity through more traditional channels. Lending through the BTFP grew quickly after its introduction, with balances spiking to over $80 billion in the first several weeks, and to over $100 billion during the first three months. Balances eventually stabilized during most of the remainder of 2023 between $100 - $120 billion. In retrospect, there’s no doubt about it. The BTFP did its job in helping to avoid a system-wide liquidity crunch. The graph below illustrates just how helpful this program was in the early days of the turmoil.
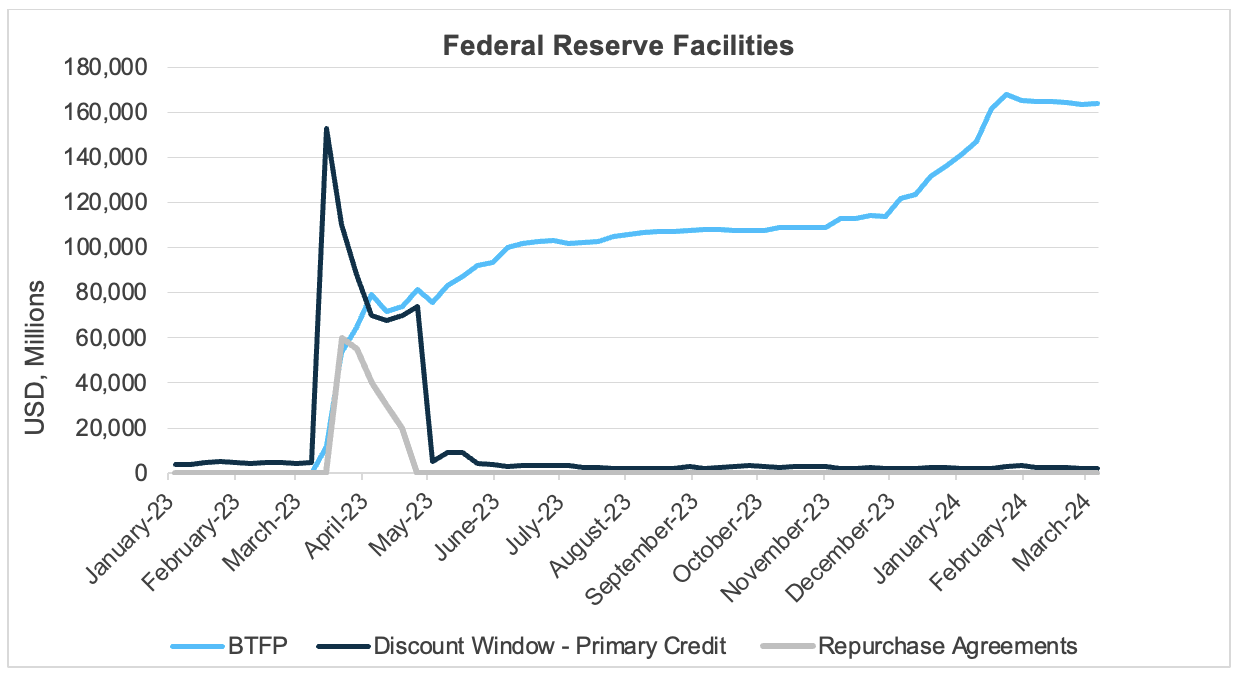
Source: Board of Governors of the Federal Reserve System (US). Retrieved from FRED, Federal Reserve Bank of St. Louis. Data as of 03/14/2024.
While this facility stood as a backstop to the U.S. banking system over the past year, it was intentionally designed as a short-term emergency program to stabilize the sector during a time of acute stress. As such, the Federal Reserve recently announced that the program would expire and cease making loans as scheduled on March 11, 2024. At the same time, the Fed also raised the rate on any new loans issued from the program to halt an arbitrage opportunity that some financial institutions had been taking advantage of – effectively pocketing the difference between the rate they paid to borrow the BTFP funds (which was tied to future interest rate expectations) and what they earned from investing the funds at the central bank as overnight deposits. As a result, BTFP borrowings surged in December and January to new record highs, though this time it wasn’t due to any new banking stress.
The relatively rapid stabilization in the U.S. banking system last year was due in part to the BTFP assuring markets that banks with underwater government securities and reduced deposit funding could use those securities to generate sufficient liquidity based on their par value. The BTFP was an innovative way to create an additional source of liquidity for banks, as well as calm market fears during a time of financial turmoil not seen since the peak of the Global Financial Crisis.
State of the U.S. Banking System
What does the closing of this “emergency” program mean about the state of the U.S. banking system? Fed officials had signaled for several months they anticipated letting the program expire in March 2024 as originally planned given the renewed stabilization across banks, despite growing concerns related to commercial real estate (CRE). While banks’ exposure to certain pressured CRE sectors (e.g., office properties) has garnered significant headlines recently, most financial institutions remain well-positioned and adequately provisioned to weather a modest increase in CRE delinquencies. In fact, Federal Reserve Board Chair Jerome Powell recently commented on this topic, noting that while community and regional banks are the ones most “challenged” by the decline in values of CRE, it remains a “manageable problem” for the nation’s largest banks.
As indicated by the chart below, CRE exposure remains concentrated to smaller regional and community banks across the U.S., with banks under $100 billion in assets averaging approximately 35% of CRE as a percentage of total loans, compared to just 10% at the largest banks in the U.S.
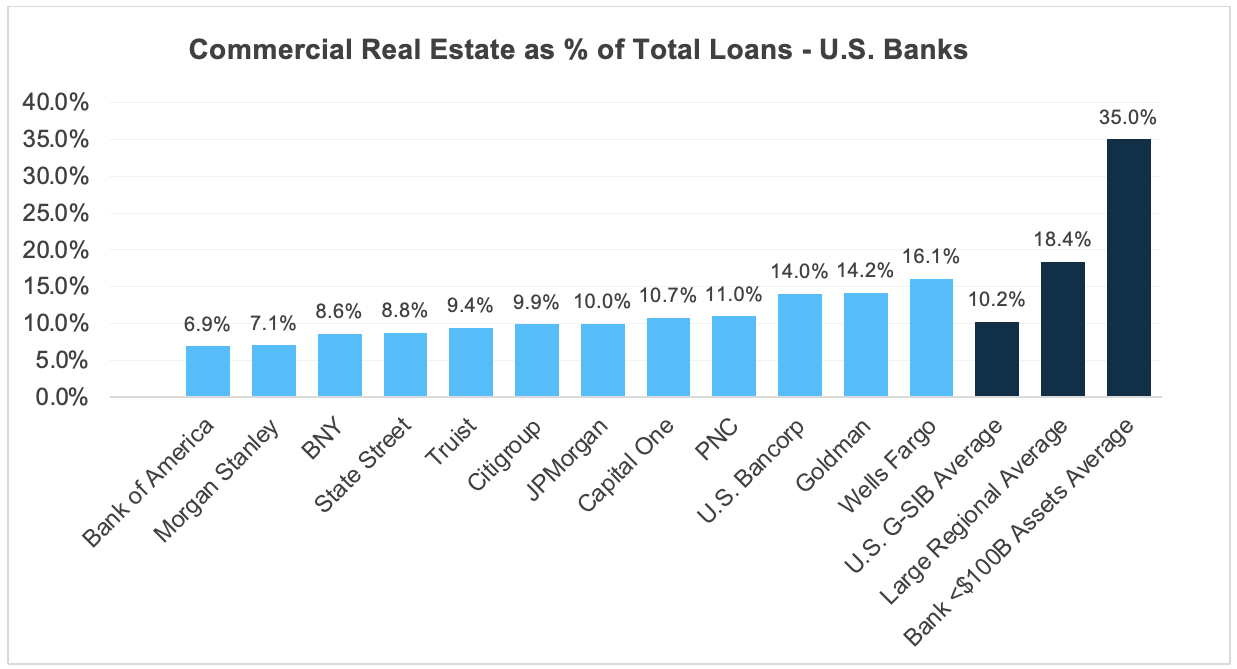
Source: Company filings, Bloomberg and Barclays Capital. Data as of fiscal yearend 12/31/2023.
Overall, asset quality across most U.S. banks remains very strong, though loan charge-offs continue to tick up from previously very low levels. While we expect loan losses to climb modestly higher in the coming quarters, particularly related to higher-risk asset classes such as CRE, these losses should remain manageable and well covered by loan loss reserves. Additionally, regulatory capital for most regional banks and G-SIBS (Global Systemically Important Banks) is materially higher than a year ago and should continue to rise given proposed changes to capital regulation.
Unrealized losses on bank security portfolios also remain of some concern, though most banks have the flexibility and liquidity from stable deposits and higher capital to help ensure these losses aren’t realized. Additionally, as the Fed begins cutting interest rates as expected later this year, current unrealized losses on bank’s books should improve.
While it’s certainly possible that we could see further pockets of stress across the banking sector, the fact that the Federal Reserve is letting a liquidity lifeline for banks expire illustrates confidence and strength in the U.S. banking system. The Fed’s other lending facilities will remain in place, including the Federal Home Loan Bank (FHLB) System and the Discount Window. These vital credit and liquidity programs, in addition to the rest of the Fed’s toolkit, should continue to support a healthy and stable banking system across the U.S.

Source: Bloomberg and Silicon Valley Bank as of 2/29/2024.